
,
12 tweets,
5 min read
Read on Twitter
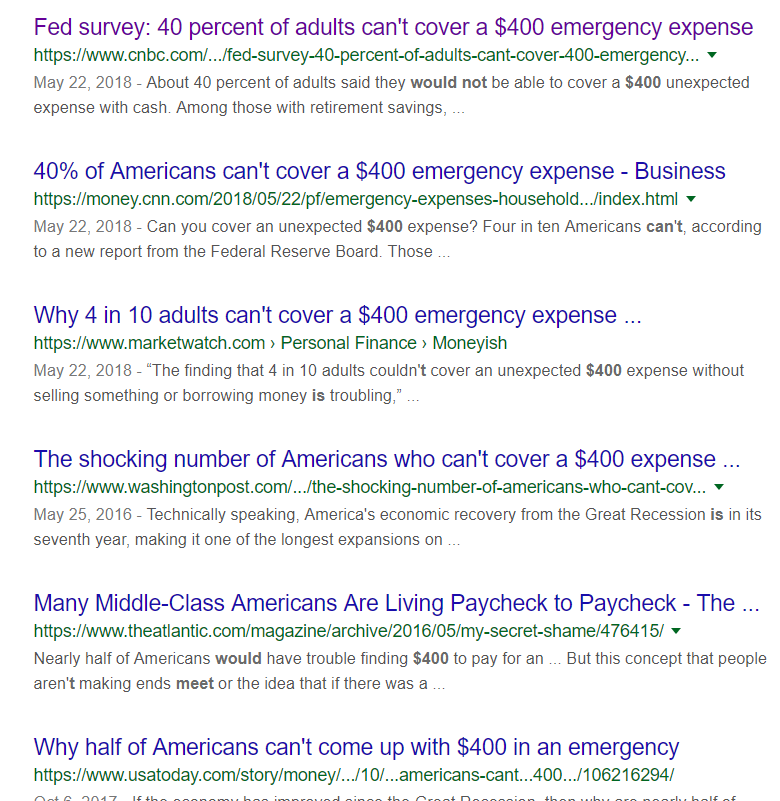
1/ There is a common line repeated in the media: "Fed survey shows 40 percent of adults still can’t cover a $400 emergency expense"
Inspired by @EconTalker to go deeper and question things I read, here is a perfect example of how people cherry pick data to fit their narrative.
Inspired by @EconTalker to go deeper and question things I read, here is a perfect example of how people cherry pick data to fit their narrative.
2/ This is not actually what the report says but it makes for good clicks.
Washington Post: "The shocking number of Americans who can't cover a $400 expense"
The Atlantic: "Many Middle-Class Americans Are Living Paycheck to Paycheck"
and some more...
Washington Post: "The shocking number of Americans who can't cover a $400 expense"
The Atlantic: "Many Middle-Class Americans Are Living Paycheck to Paycheck"
and some more...

3/ Looking at the 2016 version of this (because the 2017 version detailed data is missing) it says: "Forty-four percent of adults say they either could not cover an emergency expense costing $400, or would cover it by selling something or borrowing money" federalreserve.gov/publications/2…
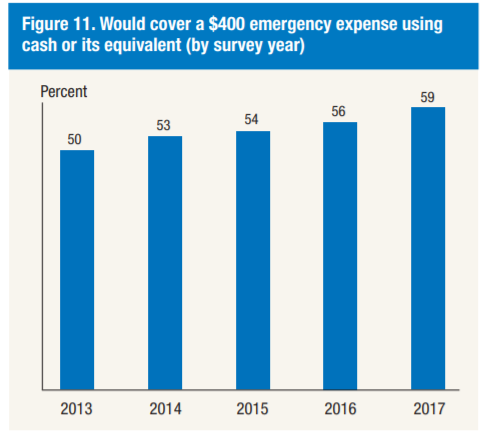
4/ If you look at the 2017 version of the report, you only find this chart which seems to show that only 60% of people can meet an expected $400 charge with cash or equivalent federalreserve.gov/publications/f…
5/ I was curious about this because it seemed low. After some digging I found the 2016 appendix (again, 2017 not to be found). Only 12% of people couldn't actually pay the expense and a smaller amount would have to borrow money (keep in mind this could be double counted)
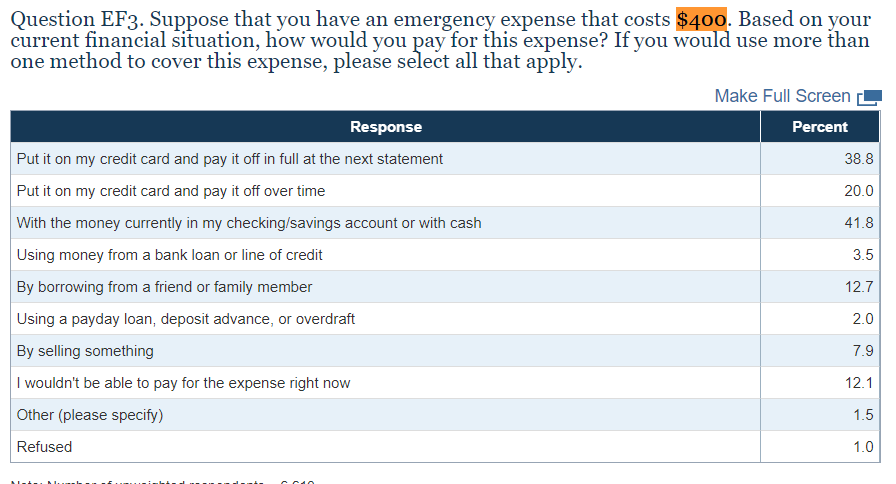
6/ Also notice that the main report counts "borrowing money" at not being able to meet the expense. 38.8% of people would "borrow" money and pay it off at the end of the month. Combining this with cash (though some people may have indicated both by accident) it is close to 80%
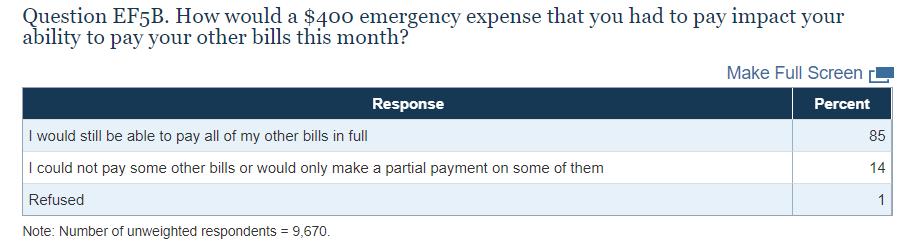
7/ Another survey question not highlighted actually gives some direct clarity on this question. It turns out only about 15% of people would not be able to cover a $400 expense.

8/ Finally, kind of hidden in the main report is the overall well-being of people's financial security. It turns out 8.5% of people are finding it difficult to get by. You could reasonably say 30% if you count the "just getting by"
In 2017 this was even better at 7%
In 2017 this was even better at 7%
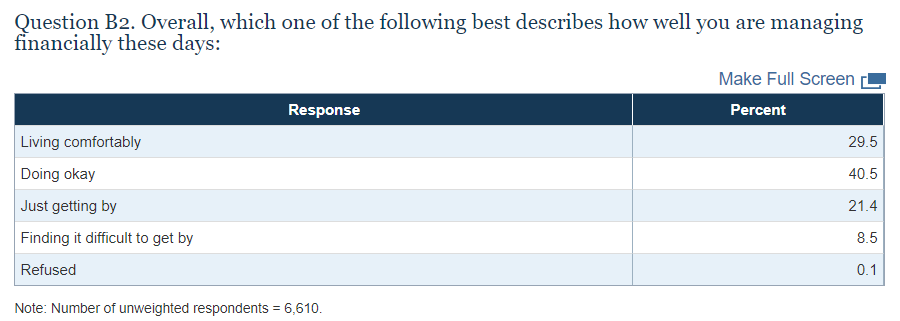
9/ The real takeaway from the report? From the main report: "fewer people are finding it difficult to get by, or just getting by, than was the case five years ago. The 7 percent of adults in 2017 who find it difficult to get by financially is about half of what was
seen in 2013"
seen in 2013"
10/ But those kind of nuanced "there are issues but things aren't as bad as they were" doesn't get clicks. @EconTalker medium.com/@russroberts/i…
@EconTalker 11/ Wow this blew up! I found the supplemental data for the 2017 report. federalreserve.gov/publications/a…
If I were a journalist that wanted to be credible, I'd use this response - 14% - I could see why they used 40% but it seems out of line with the rest of the reports takeaways.
If I were a journalist that wanted to be credible, I'd use this response - 14% - I could see why they used 40% but it seems out of line with the rest of the reports takeaways.
12/ My whole point here is that we shouldn't just take these things at face value. Many people cite the WaPo/NYT/etc.. articles as fact without ever going into the source material.


