,
10 tweets,
4 min read
Read on Twitter
1 of my goals for Twitter is to promote financial literacy. Here is a thread of how u should think about econ/financial stats.
1) Today SHCOMP rose 0.38% but that statistic needs context so u need more data;
2) Take a 13yr look at the index below 👇🏻- we call this time series.
1) Today SHCOMP rose 0.38% but that statistic needs context so u need more data;
2) Take a 13yr look at the index below 👇🏻- we call this time series.

No serious investors/student of finance should think about data w/o studying the following:
a) How data is collected (so this index & what the components are made of such as firms, sectors, ownership, etc
b) How data moves over time; & usually do the following to study it
a) How data is collected (so this index & what the components are made of such as firms, sectors, ownership, etc
b) How data moves over time; & usually do the following to study it
Went over pt A in this thread () so will focus pt B - what u should do w/ the time series. Need to do the following:
a) Eyeball the data using line graph+scatter plot & then study the following stats: mean, median, max, min & standard deviation & outliers
a) Eyeball the data using line graph+scatter plot & then study the following stats: mean, median, max, min & standard deviation & outliers
This is what you learn in basic stats class & actually most of what u need to learn in life. Unfortunately most people don't learn this in HS. But here it is:
a) Average is 2828 & low is 1180 & our price now is 2922 & max is 6092;
b) U know that this is skewed left & max outlier
a) Average is 2828 & low is 1180 & our price now is 2922 & max is 6092;
b) U know that this is skewed left & max outlier
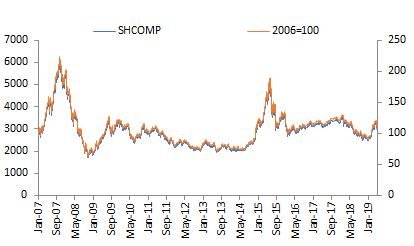
Your hit ratio of the index hitting 2925 is pretty decent but your hit ratio of 6092 is NOT. So u need to understand this. Btw, the average is skewed by the outliers so that is why people like to use median (mid pt of all the data).
Large # is confusing so people like to rebase
Large # is confusing so people like to rebase
There's more to stats than wut I just covered but that's enough for now. Anyway, REBASING is key b/c used in finance a lot to make it nicely 100.
We all get 100 b/c 5% of 100=5. How does rebasing work? Take a time u like, say Jan 2007 & divide by itself (SHCOMP was 2715)*100👇🏻
We all get 100 b/c 5% of 100=5. How does rebasing work? Take a time u like, say Jan 2007 & divide by itself (SHCOMP was 2715)*100👇🏻

Sorry, legend in earlier charts wrong and 100=2007 not 2006.
Why did I do that? To make it easier for you to see change if your starting pt is 100 (u're welcome).
Okay so 2715.7/2715.7*100=100
Table of time series 👇🏻 & chart of movements over time 👇🏻
Why did I do that? To make it easier for you to see change if your starting pt is 100 (u're welcome).
Okay so 2715.7/2715.7*100=100
Table of time series 👇🏻 & chart of movements over time 👇🏻


So I just taught you rebasing & you can do that easily w/ anything to eyeball change over time easily using a time period as a benchmark.
Good. Now let's talk about this. So if u had $100 in Jan 2007, now u have 108 so that's an 8% increase. But actually u had 113 2 days ago 👇🏻
Good. Now let's talk about this. So if u had $100 in Jan 2007, now u have 108 so that's an 8% increase. But actually u had 113 2 days ago 👇🏻

Should have sold on 4 April when it was 120. But if u're long term, well u can wait for it to bounce back. Btw, in Nov 2018, u were down 5% of ur initial 100 in 2007 & only had 95 😬
But on 2 June 15, it was up 181 but down to 91 by 2 Jan 2019 😬.
That is called high volatility
But on 2 June 15, it was up 181 but down to 91 by 2 Jan 2019 😬.
That is called high volatility
The next time someone tells u their funds/security/econ go up by XX% in a day/month/yr, ask the following:
a) If I gave u 100 dollars 10yrs ago, wut is it today?
b) What is the mean, max, min, median, standard deviation
c) What is the composition?
Sincerely,
@Trinhnomics
a) If I gave u 100 dollars 10yrs ago, wut is it today?
b) What is the mean, max, min, median, standard deviation
c) What is the composition?
Sincerely,
@Trinhnomics