,
13 tweets,
5 min read
Read on Twitter
Interested in performing power analysis but not sure where to start? Check out the "jpower" module in @jamovistats, from @richarddmorey.
The way this module is structured is an excellent introduction to power analysis, here's how it works...
The way this module is structured is an excellent introduction to power analysis, here's how it works...
By doing a power analysis, you can assess the sensitivity of a design and test. Typically, researchers are interested in calculating the minimum sample size needed to have a study sensitive enough to reliably detect a specified effect size
Let's say you want to calculate the required N for an independent samples t-test. First, you need to consider and specify your "minimally interesting" effect size in the context of your research. Here, we're going with 0.6. 

Using effect sizes from prior research or pilot studies is not a great idea, as these effect sizes are likely to be inflated. Moreover, these effect sizes probably aren't relevant for what you want to show for *your* research
By selecting a minimally interesting effect size of 0.6 in our power analysis, we're saying that for our research question an effect size ≥ 0.6 is interesting, and we want to reliably detect this effect, or greater, at probability that we specify...
The probability that you will reliable detect such an effect depends on your "Minimum desired power". Setting it at 0.9 means that your probability is 90%
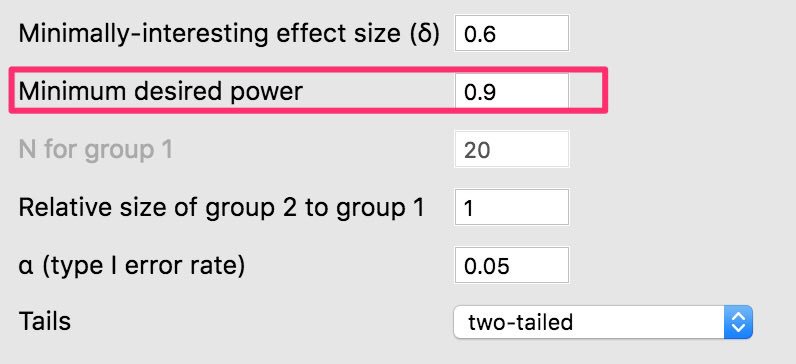
You can also specify your Type 1 error rate. Here, we're going with the conventional error rate of α=0.05. You can also redefine your error rate as α=0.005 or justify another error rate. You do you.

So here are the results for an independent samples t-test, for two equal groups. You'll need 60 per group to reliably detect an effect ≥ 0.6, with a probability greater than 90%, allowing for an max Type I error rate of α=0.05.

Now here's where things get really cool...
This module calculates how likely your specified design would detect a range of effect sizes. In this instance, if the true effect size was ≤ 0.361, then you would have ≤ 50% power to detect it, which means it's likely you'd miss it
This module calculates how likely your specified design would detect a range of effect sizes. In this instance, if the true effect size was ≤ 0.361, then you would have ≤ 50% power to detect it, which means it's likely you'd miss it

This module also includes plain-language explanatory text that comes with each generated table and plot. Just select the "Explanatory Text" option.

You can also generate power contour plots, which visualise how the sensitivity of the test changes when when you adjust the effect size and sample size parameters.

To try this out for yourself, download @jamovistats, and then load the 'jpower' module from the JAMOVI library.
You can perform power analyses for independent samples t-tests, paired sample t-tests, and one sample t-tests.
You can perform power analyses for independent samples t-tests, paired sample t-tests, and one sample t-tests.
@jamovistats If you want to read more on this topic, check out these power analysis primers