
,
12 tweets,
4 min read
Read on Twitter
Recently, a few people on here have attacked me because I don't follow patterns/technical analysis and they've called me a "dweep, strange and a non-believer"!
Well, what better way than to objectively test some of the most popular technical indicators via actual backtests?...
Well, what better way than to objectively test some of the most popular technical indicators via actual backtests?...
So, this is exactly what I've done today - backtested a bunch of commonly used technical indicators on $SPX with data going back 30 years and compared each strategy's performance to 'Buy&Hold'...
The results are here (with the screenshots of backtests), you can be the judge...
The results are here (with the screenshots of backtests), you can be the judge...
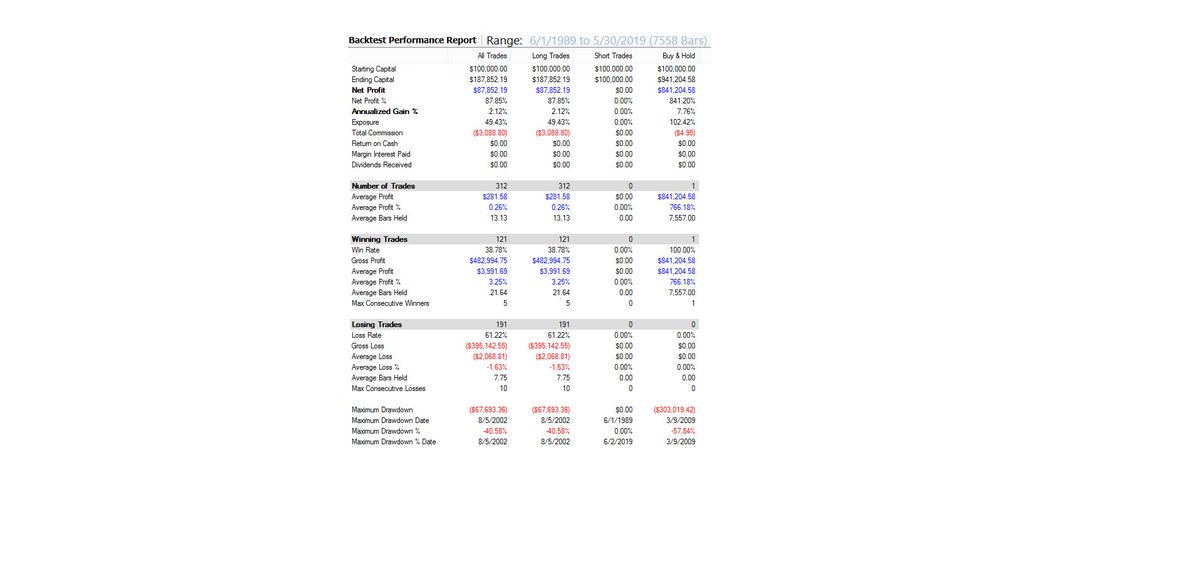
1) MACD crossover strategy vs. Buy&Hold -
$100K is now worth $188K in MACD strategy (2.12%CAGR)
$100K is now worth $941K in Buy&Hold (7.76%CAGR)
$100K is now worth $188K in MACD strategy (2.12%CAGR)
$100K is now worth $941K in Buy&Hold (7.76%CAGR)
2) Stochastic crossover strategy vs. Buy&Hold -
$100K is now worth $151K in Stochastic crossover strategy (1.38%CAGR)
$100K is now worth $941K in Buy&Hold (7.76%CAGR)
$100K is now worth $151K in Stochastic crossover strategy (1.38%CAGR)
$100K is now worth $941K in Buy&Hold (7.76%CAGR)

3) RSI strategy (buy when RSI goes above oversold, sell when it goes below overbought) vs. Buy&Hold -
$100k is now worth $175K in RSI strategy (1.89%CAGR)
$100K is now worth $941K in Buy&Hold (7.76%CAGR)
$100k is now worth $175K in RSI strategy (1.89%CAGR)
$100K is now worth $941K in Buy&Hold (7.76%CAGR)

4) CMO strategy (buy when CMO goes above oversold, sell when it goes below overbought) vs. Buy&Hold -
$100K is now worth $187K in CMO strategy (2.1%CAGR)
$100K is now worth $941K in Buy&Hold (7.76%CAGR)
$100K is now worth $187K in CMO strategy (2.1%CAGR)
$100K is now worth $941K in Buy&Hold (7.76%CAGR)

5) Bollinger bands breakout strategy (buy when price breaks out above the upper bollinger band, sell when price dips below the upper bollinger band) vs. Buy&Hold -
$100K is now worth $111K in Bollinger bands strategy (0.34%CAGR)
$100K is now worth $941K in Buy&Hold (7.76%CAGR)
$100K is now worth $111K in Bollinger bands strategy (0.34%CAGR)
$100K is now worth $941K in Buy&Hold (7.76%CAGR)

6) 200day SMA strategy (buy when price breaks above 200day sma, sell when price closes below 200day sma) vs. Buy&Hold -
$100K is now worth $531K in 200-day sma strategy (5.73%CAGR)
$100K is now worth $941K in Buy&Hold (7.76%CAGR)
$100K is now worth $531K in 200-day sma strategy (5.73%CAGR)
$100K is now worth $941K in Buy&Hold (7.76%CAGR)

7) 100day SMA strategy (buy when price breaks above 100day sma, sell when price closes below 100day sma) vs. Buy&Hold -
$100K is now worth $262K in 100 day SMA strategy (3.26%CAGR)
$100K is now worth $941K in Buy&Hold (7.76%CAGR)
$100K is now worth $262K in 100 day SMA strategy (3.26%CAGR)
$100K is now worth $941K in Buy&Hold (7.76%CAGR)

8) 50day SMA strategy (buy when price breaks above 50day sma, sell when price closes below 50day sma) vs. Buy&Hold -
$100K is now worth $220K in 50day SMA strategy (2.67%CAGR)
$100K is now worth $941K in Buy&Hold (7.76%CAGR)
$100K is now worth $220K in 50day SMA strategy (2.67%CAGR)
$100K is now worth $941K in Buy&Hold (7.76%CAGR)

I'm not saying that all technical traders lag the markets; some traders are very good and they beat the markets over time. However, hard data presented here confirms that classical technical analysis + indicators have significantly lagged $SPX over the past 30 years.
Finally, I haven't cherry picked the start date of my backtest. If one had invested in $SPX on 1 Mar '00 or 1 Oct '07 (two of the worst possible times to invest in decades) and simply held on, the investment today would have outperformed ALL indicators posted in this thread!


