
,
13 tweets,
4 min read
Read on Twitter
Let’s play a little game.
Let’s say that you’re the CSO at a cancer pharma company, and you have to choose a target to go after.
Here’s a gene – high expression is associated with poor prognosis in brain cancer. Looks like a good candidate for an inhibitor right?
Let’s say that you’re the CSO at a cancer pharma company, and you have to choose a target to go after.
Here’s a gene – high expression is associated with poor prognosis in brain cancer. Looks like a good candidate for an inhibitor right?
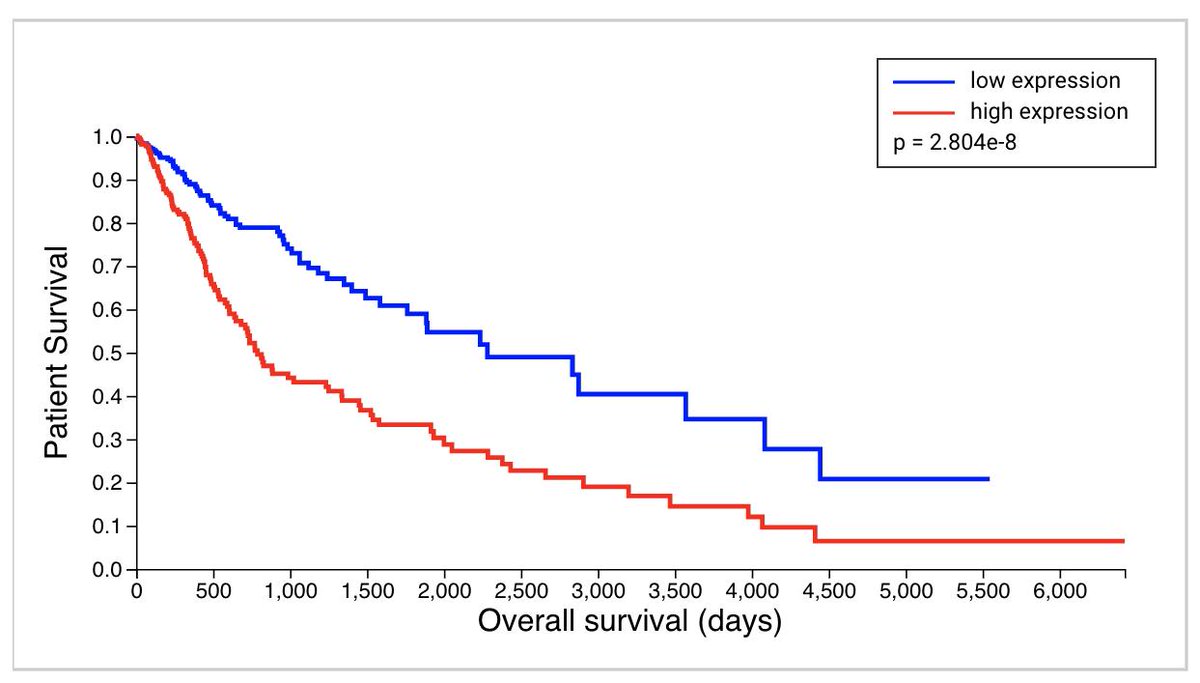
You just chose to inhibit the tumor suppressor RB1. Your investors are not happy!
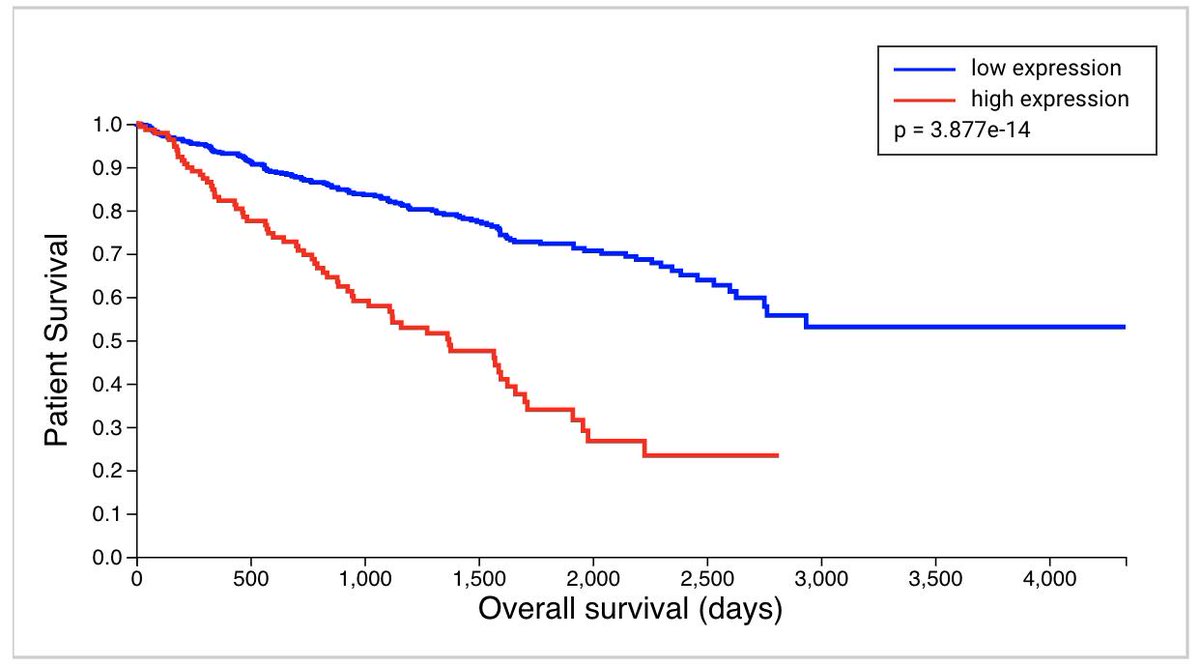
Let’s try another one – how about this protein in breast cancer? It’s not strongly associated with outcome. Safe to pass on, right?

Well that’s the survival curve for estrogen receptor expression – one of the most successful drug targets of all time.
OK, let’s make it easier. Expression of this protein is associated with **improved** survival in melanoma. Obviously you want to increase its expression, right? Inhibiting it would be crazy!

You just passed on nivolumab – that’s the KM plot for PD1 expression in melanoma. High PD1 is associated with improved survival because it’s indicative of immune infiltration – but inhibiting it is still clinically effective.
Here’s another one. Which one of these genes drives aggressive disease? A gene in prostate cancer (left) or a different gene in kidney cancer (right):

The KM curve on the left is the androgen receptor – the key driver of prostate cancer. The curve on the right is an olfactory receptor.
Well, expression curves are kinda iffy. Maybe it’s more clear if we look at mutation data? Here’s wild-type vs. mutant data for two genes in colon cancer. Which do you want to inhibit?

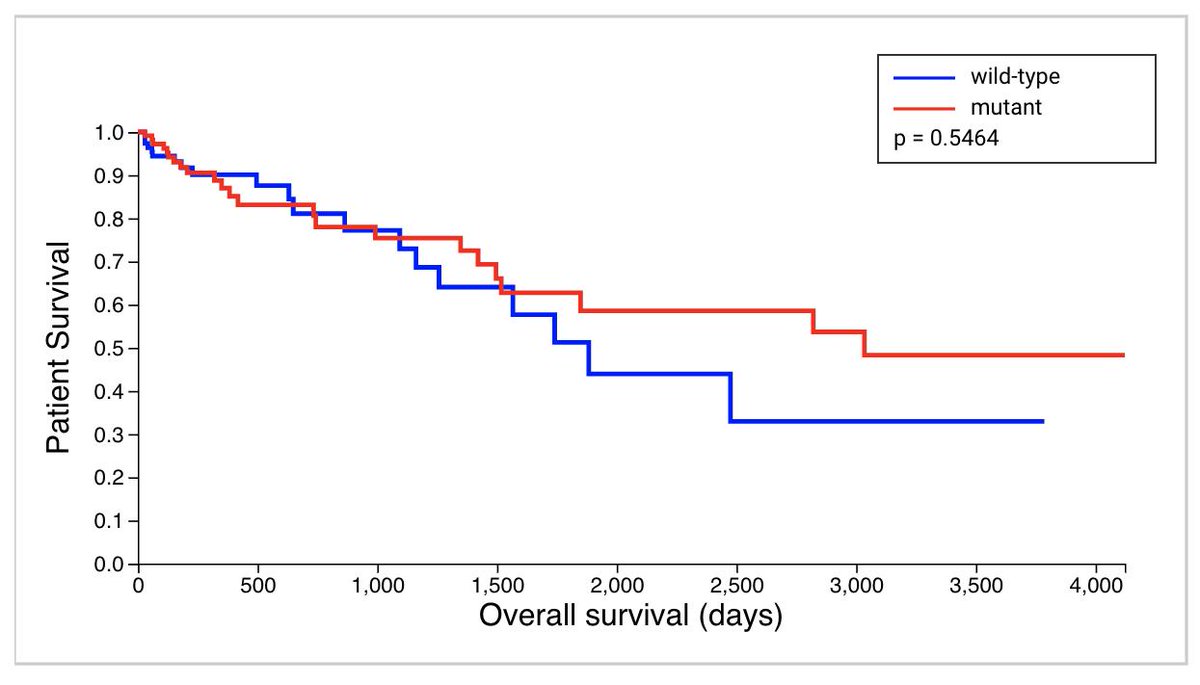
If you chose the gene on the left, you chose to inhibit proto-cadherin instead of mutant KRAS.
...in some papers and presentations, biologists will use TCGA survival curves showing that their favorite gene is associated with poor prognosis to argue that their gene is super-important. This is weak evidence.
*Prognostic biomarkers are not necessarily strong cancer drivers*
*Prognostic biomarkers are not necessarily strong cancer drivers*
I think that biomarker analysis can be useful for patient treatment and to nominate interesting candidate genes. But one KM plot alone isn’t enough to prove anything – and if you rely too much on survival correlations, you will miss 95% of the important genes in cancer.
If you want to know more, you can check out the paper that @joans and I wrote analyzing all of the TCGA survival data: ncbi.nlm.nih.gov/pubmed/30526857
The KM plots are from the website we built: survival.cshl.edu.
The KM plots are from the website we built: survival.cshl.edu.


