,
17 tweets,
5 min read
Read on Twitter
16 part thread on where the U.K. Conservative party has historically, and is still, under-performing, and why that's interesting for any upcoming election…(1/16)
Around 80-90% of why certain seats vote for certain parties is explained by the demographics of the area e.g. – how many graduates are there, how rich is the seat, how many people have gone to university, what is the ethnic composition and what type of jobs do people have? (2/16)
We know this because statisticians/political scientists/strategists create regression models (maths which explains why a seat votes x% Tory + y% Labour based on multiple variables jammed into an equation that works even if you shift around the training data it is based on) (3/16) 

Interesting question is why certain areas/conurbations vote differently to how you would expect them to demographically. How do we explain the rural, affluent seat that never votes Tory (Sefton Central), or that densely populated, London seat that does (Putney) (4/16)
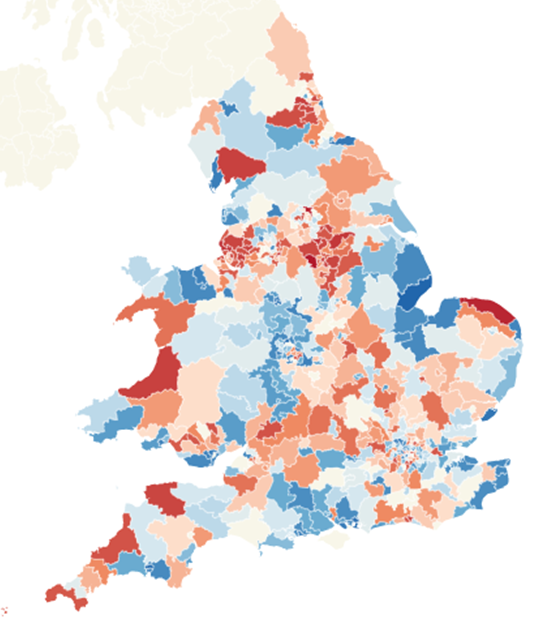
Seats that the Tories under-perform systematically (even in 2017) are not randomly distributed around the country. These "unders" are concentrated geographically in adjacent clusters. This is because of history and culture, and is nothing to do with maths or demographics (5/16)
We should care about these "unders". A number of them (20-25) are held by Labour and have a Tory vote that - on a demographic basis - should be 5% or higher, and an existing baseline Tory vote that is 30%+ already. These are launchpads for victory if you are No 10 (6/16)
The history of an area matters – the leave voting 55yr old plumber living in a detached house is more likely to vote Tory in Bournemouth than Wigan, even on the same salary. If the Tories manage to culturally de-toxify in certain seats there is a huge unlocked vote there (7/16)
Looking at the conurbations where the Conservatives in 2017 did less well, by 5% or more than you demographically would expect, one can see there are four buckets of seats (all coloured red) (8/16)
The first is a huge "red wall" stretching from N Wales into Merseyside, Warrington, Wigan, Manchester, Oldham, Barnsley, Nottingham and Doncaster. When you talk about cultural barriers to voting Tory – this is where it is. This entire stretch shouldn't be all Labour but is (9/16)

Everybody knows about the Conservatives + Liverpool. Less so about the electoral roadblock stretching across the North West + Yorkshire, a conurbation of 4m+ people where anti-Conservativsm is still entrenched. Most of Lab-Con gains (see below) where here in 2017 (10/16)

The 2nd group of seats is in the S.West, a stretch of independent/non-conformist and Leave voting seats, where the yellow knotweed has survived Crosby’s 2015 hit job. A Lib Dem surge could be the revolt of Wessex, of hundreds of adjacent seats from Cornwall to Berkshire (11/16)

The 3rd group of seats where the Tory vote is under-powered by 5% or more is in a seam of first time incumbent seats in 2017. New candidates at the next General should expect a discount, irrespective of the seat dynamics (12/16)
The last group of "unders" include Coal mining areas of the North East and South Wales. Some of these seats had big positive Tory swings last election, but the baseline level of support is still lower than you would demographically expect. Detoxification isn't complete. (13/16)


The upshot is that the current No 10 strategy of seeking a Leave-voting, older, non-graduate electoral coalition makes some sense given the potential upside. There are huge numbers of unlocked votes across that Red Wall which a Tory brand shift *could* dislodge - big if (14/16)
However....To assess the downside of No 10 Strategy all eyes should be on North Norfolk and Westmorland. These are seats that should always have a Tory vote >60%+. Instead the Tory vote is suppressed 19% and 13% respectively because of the Lib Dems. (15/16)

If the Lib Dems can roll out the Westmorland-Norfolk model elsewhere that brings into play 200 seats. If you want to assess whether the new administration is winning and changing the Tory brand, go to N Wales, Warrington, Wigan, Oldham, Barnsley, Nottingham and Doncaster (16/16)
Mapping here the residuals of the regression equation (over and under performance) really gives voice to the argument + the massive overperformance in the Midlands/Staffordshire...(17/16)