Good morning, lots to digest but bottom line is that global growth is cooling & I suppose the silver lining is that central banks'll cut & expand their balance sheet if they have space (Fed ✂️& soft QE).
In Asia, Australia consumer confidence 📉🦘🇦🇺 &✂️helpful on the margin but
In Asia, Australia consumer confidence 📉🦘🇦🇺 &✂️helpful on the margin but

W/household debt as a share of GDP high (& u know that households don't pay RBA cash rate of 0.75% & pay the highest risk premium of all the sectors of the economy & so high household debt = high interest expense & less disposable income) confidence low👇🏻
And Australia is not alone - see my thread above on Asian debt dynamics & while u're at it read my double Ds pinned tweet on demographic & debt too. Korea got high household debt & disposable income to household debt is really bad & the BOK is concerned. Malaysia & Thailand too!
Chinese households used to not be indebted but now they are as well and the debt they hold is also high interest expense as well as plenty of credit debt & we all know that is not good debt as it is for consumption not investment. Americans know this well.
Anyway back to data.
Anyway back to data.
Overnight US PPI declined on the month (September 2019 vs August 19) by -0.3% for core PPI & final demand. On a YoY basis, core PPI (ex food & energy) slowed to 2% from 2.3%. Ex trade & food & energy is 1.7% from 1.9%.
PPI = producer price index 👇🏻
CPI = consumer price index
PPI = producer price index 👇🏻
CPI = consumer price index

For those that don't spend ur life slice & dice data, let's go through some basics. An index is constructed by taking data. So u give some weight to things that matter more.
The @BLS_gov produces this. Largest weight = services. Food 5.7% out of 100 👇🏻
bls.gov/ppi/ppifaq.htm…
The @BLS_gov produces this. Largest weight = services. Food 5.7% out of 100 👇🏻
bls.gov/ppi/ppifaq.htm…
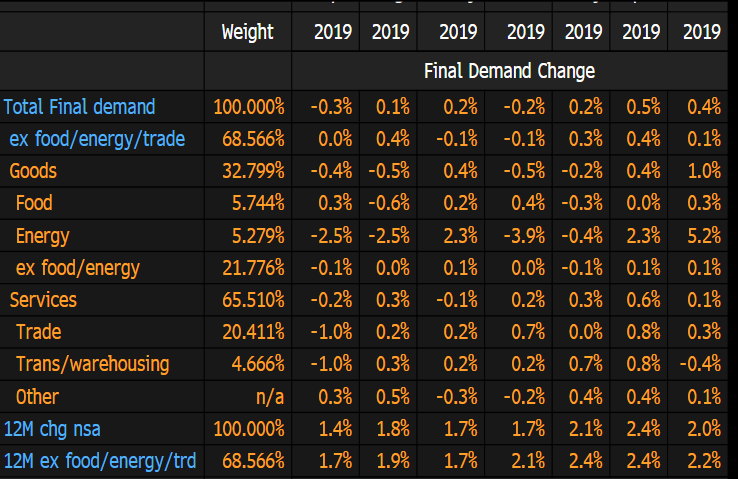
@BLS_gov Weights = importance for producers. Trade 20.4%; energy 5.3%, food 5.7% (note that when people talk about core they take out food & energy as consider that volatile).
Can see that biggest drop is energy & also trade & trans/warehouse after increases earlier 👇🏻👇🏻
Can see that biggest drop is energy & also trade & trans/warehouse after increases earlier 👇🏻👇🏻

@BLS_gov At the bottom of this u see 12-month change non seasonally adjusted, which just means %YoY ( September 2019 vs September 2018). Reason why we care about %YoY is that it's supposed to strip out seasonal factors.
Pt is that prices for producers slow after a pick-up in August 👈🏻👈🏻
Pt is that prices for producers slow after a pick-up in August 👈🏻👈🏻
@BLS_gov Why does this matter? It relates to 2 things: a) impact of tariffs on US producers (clearly as JPO says that it is not a major issue after a huge spike earlier as prices are decelerating); b) people also look at this as a sign of demand by US producers & the US economy in general
@BLS_gov And we care about this in EM Asia because it relates to both the trade-war (whether Trump et al will continue to escalate or cave as whether US producers can actually find alternatives & keep prices contained w/o massive erosion of profit margin) & Fed/USD as in capital flows 👈🏻