1. Announcing the 8th installment of our “2C: Beyond the Limit” series, in which @PostScottWilson and @mrchavezphoto visit the CA county where a 1969 oil spill helped trigger Earth Day – Santa Barbara -- but which is now experiencing rapid climate change. washingtonpost.com/graphics/2019/…
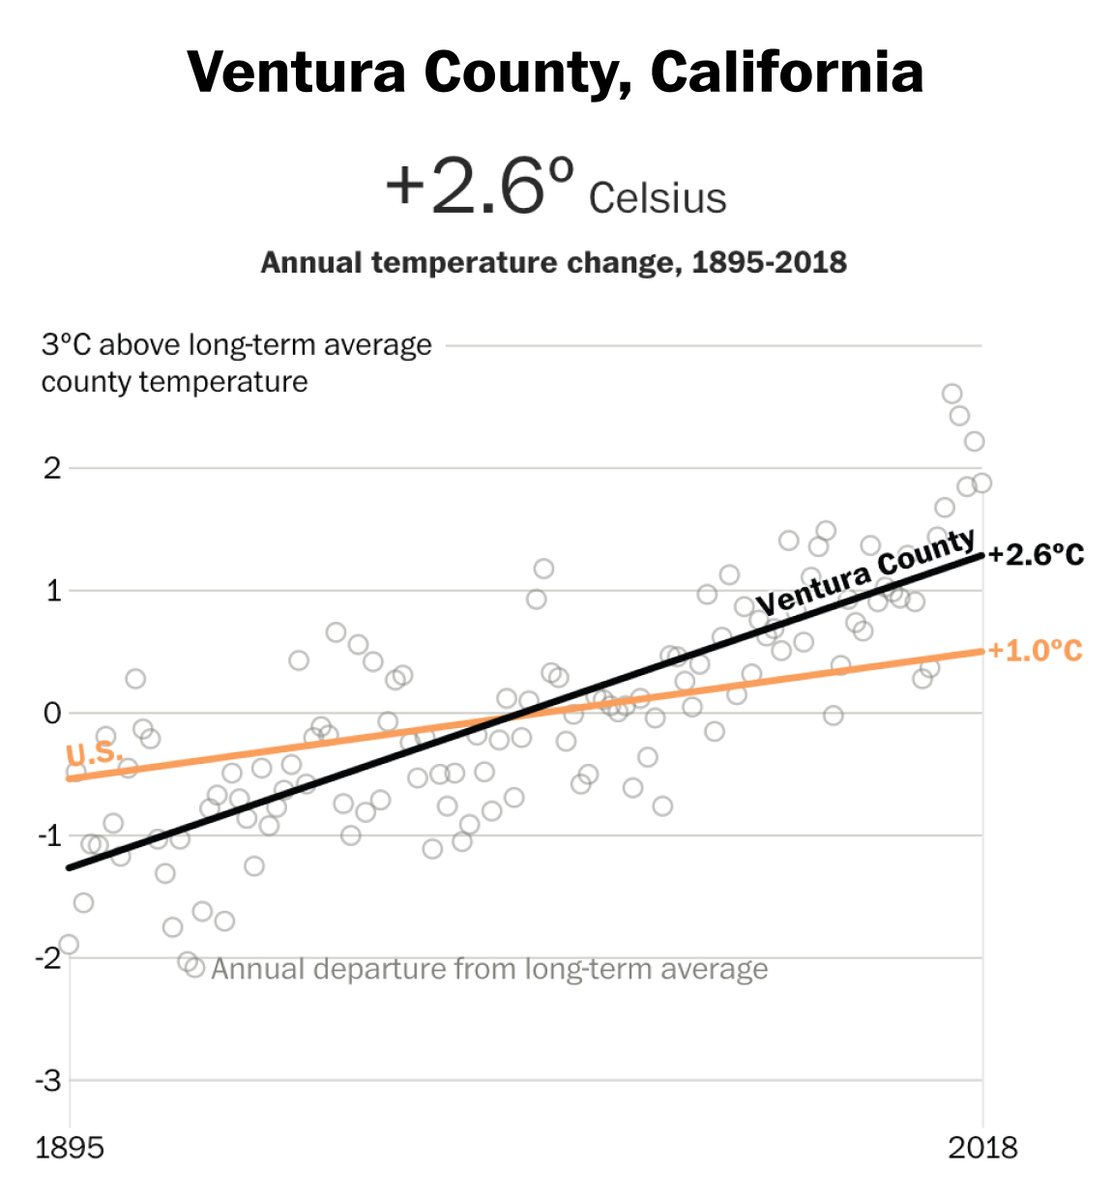
2. Santa Barbara is one of a cluster of counties in Southern California that showed up as having outsized warming from 1895-2018 when we looked at @NOAA’s county level data. The others are Ventura, Los Angeles, Orange, and to a somewhat lesser extent, San Diego.
3. These counties are all adjacent to one another and together add up to a significant hotspot. So, it seems pretty clear something has been happening in this region to amplify climate change since 1895, compared with the U.S. as a whole or with other parts of California. 

4. Ventura County in particular shows a dramatic 2.6C (4.7 F) of warming, and that’s using an analysis method that, in this particular case, I'd call conservative. If you look at the most recent years (top right) below, they are way above the trendline.
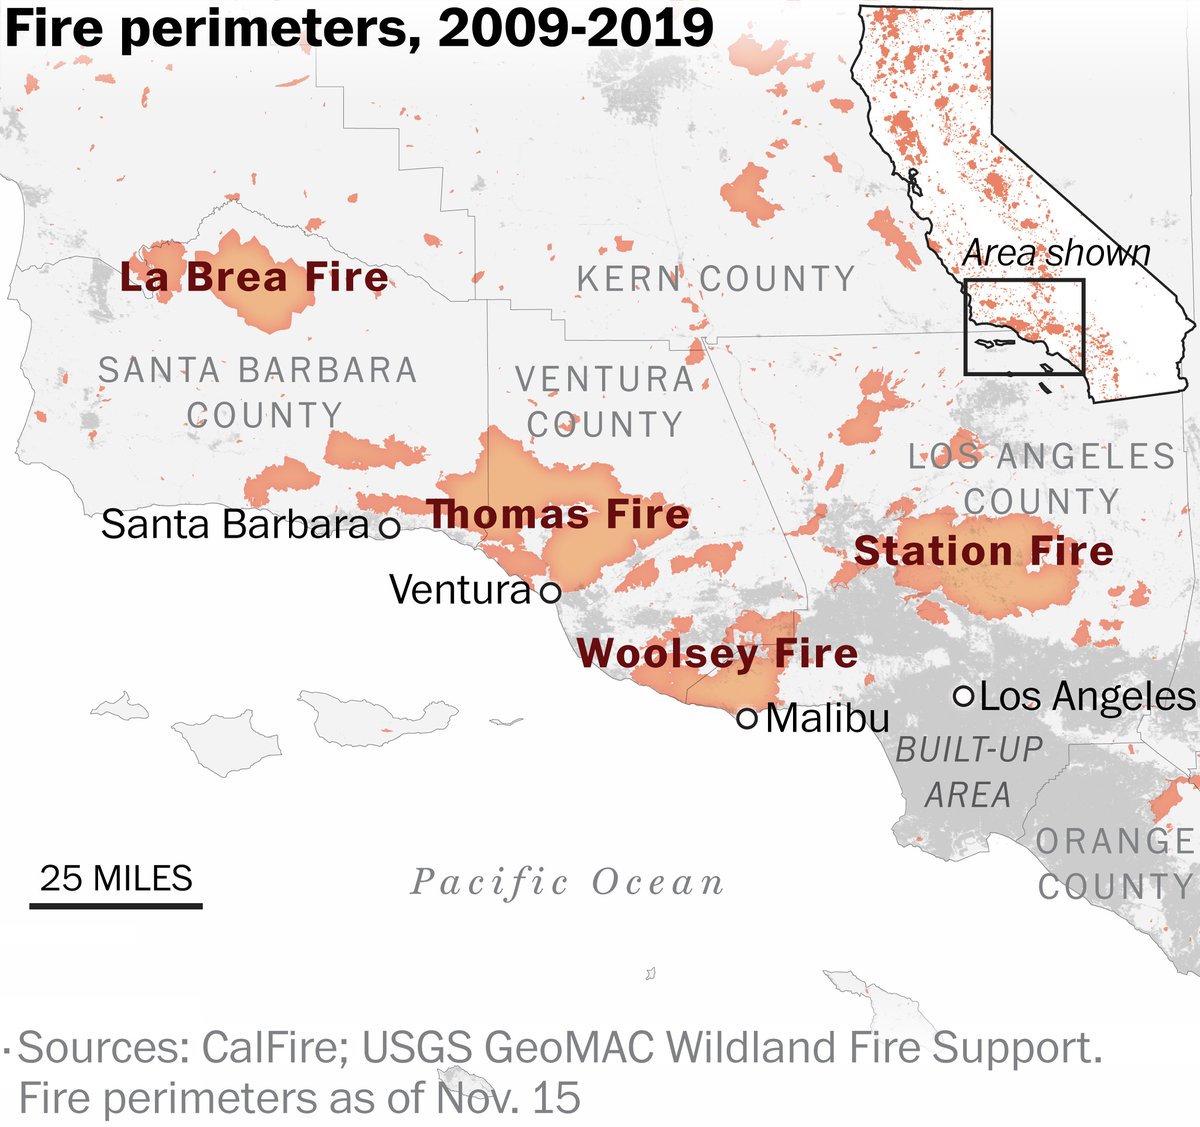
5. At the same time, in the most recent years these counties have been scorched by devastating, in some cases record-setting wildfires.
6. We did a lot of research to figure out why this particular part of the country showed a climate change hotspot. It turns out there is not any definitive answer.
7. When it comes to Los Angeles and Orange counties, clearly, there has been considerable urban growth over the last 100 plus years. The @NOAA data that we are using try to control for that, but may not do a perfect job.
8. So urbanization could be a factor, but given the methods built into the NOAA dataset, and other evidence, seems unlikely to be the only one.
9. Offshore, the ocean in this region has also shown rapid warming, well above the global average, in the broad area most recently made famous due to the California coastal “blob”. That probably influences land temperatures as well.
10. And then, well, there is this intriguing and worrying idea about low lying coastal clouds, sometimes called the “marine layer.” They have been in significant decline in much of this area. See here
researchgate.net/publication/32…
researchgate.net/publication/32…
11. Fewer clouds means more solar radiation hitting the surface, more evaporation of soil moisture, and more fire risk. Oh, and higher temperatures.
12. Some combination of these causes – and other possible causes that we don’t necessarily understand yet – may explain why southern California is seeing such high levels of warming.
13. In this context, @PostScottWilson focuses on Santa Barbara county, which has warmed by 2.3C – and again, that's probably conservative -- and captures the already dramatic changes it has seen.
14. Even in the absence of a full understanding of what is happening, farmers, fire managers, utilities, and citizens are already adapting to a new reality.
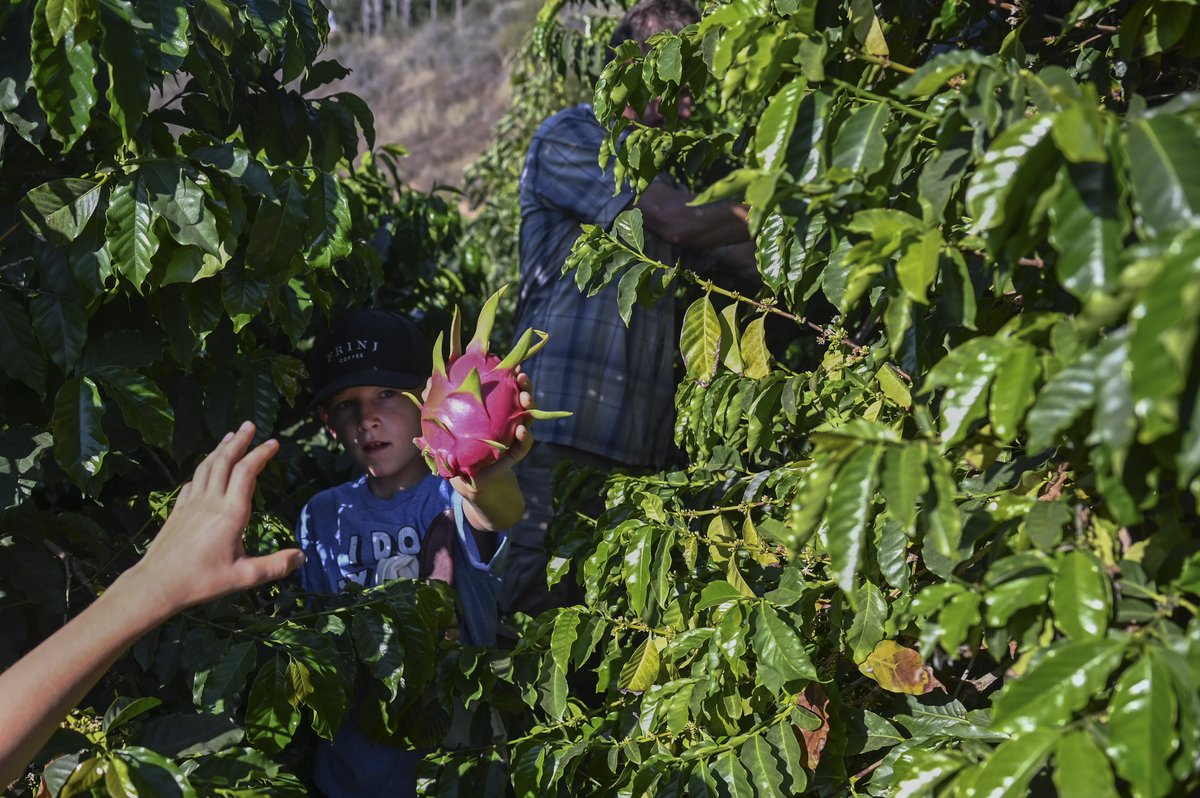
15. Farms in Santa Barbara county, for instance, are changing the crops they plant – including experimenting with agave and dragon fruit, passion fruit, and coffee – all traditionally from more tropical climes.
16. What’s most striking, though, is the political difficulty of changing, even in a community that thinks of itself as progressive and, again, where modern U.S. environmentalism itself kicked into gear in 1969, due to a massive oil spill off shore.
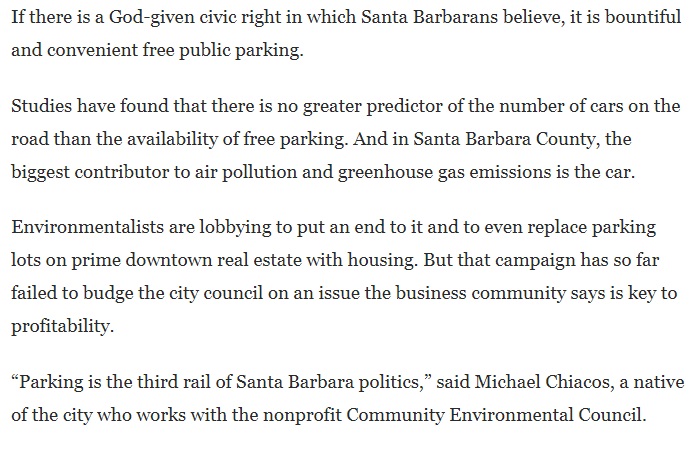
18. Santa Barbara county is actually struggling to reduce its greenhouse gas emissions, despite a pledge to do so.
19. This story builds on our first 2C piece, which provided a warming map of the entire US lower 48 states -- and also contains a feature that lets you search for the warming trend for your own county. washingtonpost.com/graphics/2019/…
20. The tool instantly analyzes over 100 years of data, from @NOAA, for thousands of counties in the lower 48. You should definitely check it out.
21. We got a lot of questions earlier this year, when our story ran, about why there was a dramatic warming hotspot in Southern California.
22. Now, thanks to @PostScottWilson and @mrchavezphoto we've not only attempted to answer the "why" question but, at the same time, shown that the consequences are already real and dramatic.
23. So please, check out their story, and stay tuned for more as we continue to explore climate change's hotspots, both in the U.S. and around the globe: washingtonpost.com/graphics/2019/… /end