Chart 1
Weekly Chart: Since reaching the all time low of 2.47 in Jan. 2016 the price has climbed steadily and taking off in Sept. 2018. It currently sits, approximately, some $2.30 off the all time high at 21.55 and .....
CZZ 2/4
Weekly Chart: Since reaching the all time low of 2.47 in Jan. 2016 the price has climbed steadily and taking off in Sept. 2018. It currently sits, approximately, some $2.30 off the all time high at 21.55 and .....
CZZ 2/4
..... running into top side #resistance with synthetic resistances further up. Price has moved far away from the #SMA 50 & 200 and we await a small correction.
CZZ 3/4
CZZ 3/4
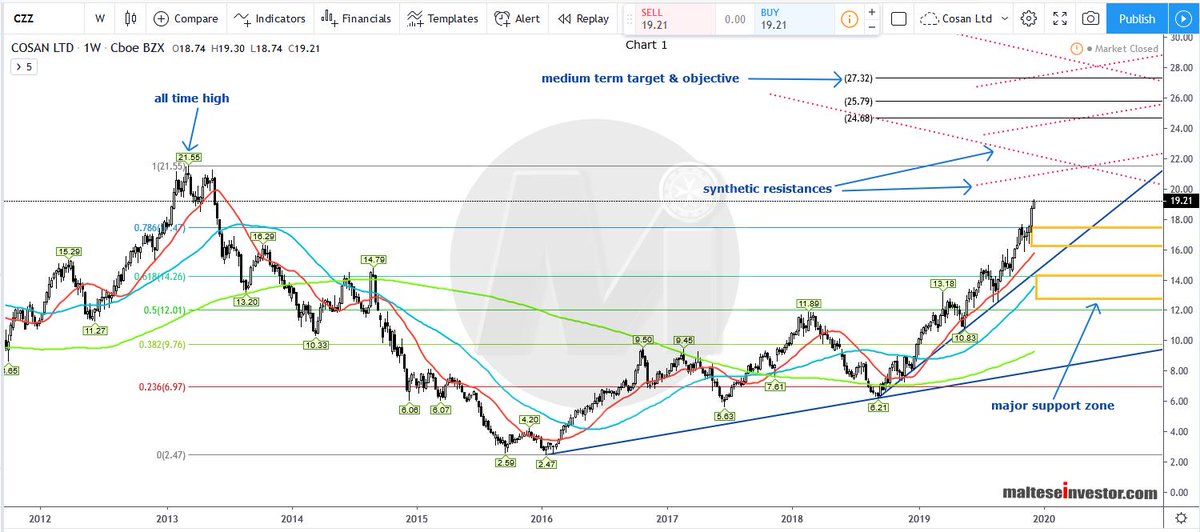
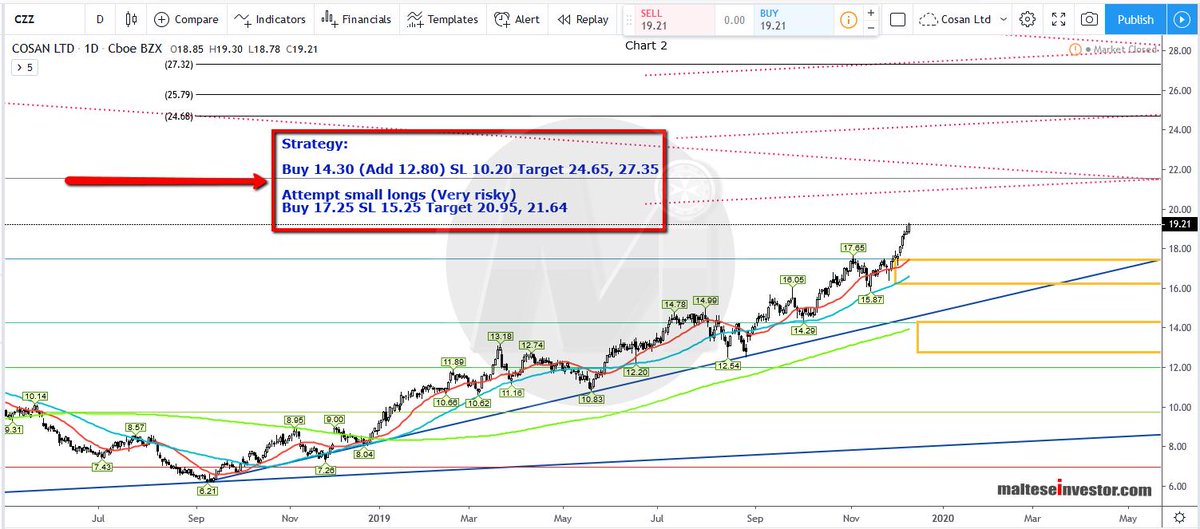
Chart 2
Daily Chart: #Trendline support is found at 14.50 with the SMA 200 postioned below at 13.94.
The #Strategy is printed on the image.
The second recommendation is risky and the #SL is tight. Upon entry be prepared to trail the SL on up moves.
$CZZ 4/4
Daily Chart: #Trendline support is found at 14.50 with the SMA 200 postioned below at 13.94.
The #Strategy is printed on the image.
The second recommendation is risky and the #SL is tight. Upon entry be prepared to trail the SL on up moves.
$CZZ 4/4