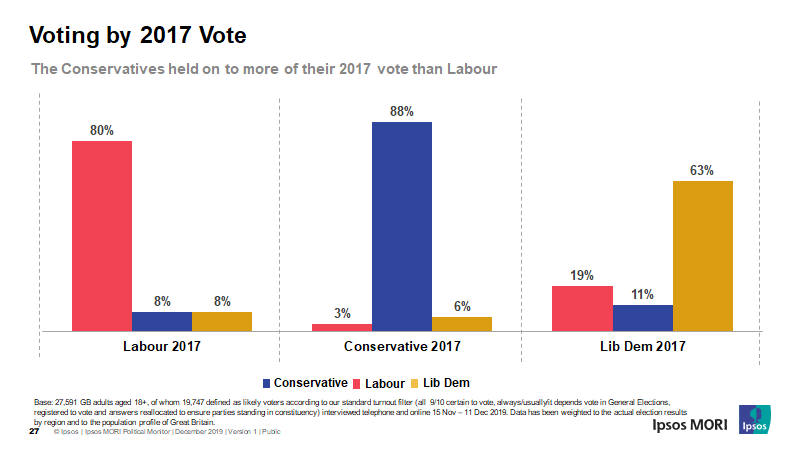
NEW: @ipsosmori’s How Britain Voted 2019. Why did the Cons win? Firstly, because they held on to more of their 2017 voters than Lab and gained more 2017 Lab voters than Lab took from them. Net movement of 2017 Lab voters from Lab to Con boosted the Con lead from 6.5% to 12%. 
Secondly, the Conservatives won most of the Leave vote while the Remain vote was much more split. In fact, the Lib Dems and SNP ended up winning more of the Leave vote than the Brexit Party with 5% to 4%, while the Lib Dems, SNP, and Greens together won 31% of the Remain vote.

Thirdly, the Conservatives held onto a greater proportion of their 2017 Remain voters than Labour did for its 2017 Leave voters. BUT: Labour had more 2017 Remain voters so it lost 6 Remain voters for every 5 Leave voters.

However, worth noting that 70% of Lab Leave switchers voted Con compared to 14% of Lab Remain switchers, so far more of them counted twice towards the Con-Lab swing.
The Conservatives won among every social class for the first time ever since our data began in 1974. Class used to be the key dividing line of British politics but the flattening of lines in this chart show that on the traditional measure of social class this has changed.

In contrast, the age divide in voting is the biggest since our estimates began in 1979. Labour had a 43 point lead among voters aged 18-24 but the Conservatives had a 47 point lead among those aged 65+.

The education divide in voting has also increased since 2017, with Labour leading by 5 points among graduates while the Conservatives had a 15 point among non-graduates.

There was a gender gap with the Conservatives ahead of Labour by 15 points among men, and 9 points among women. Our data shows that gender gap used to be the other way around with women slightly more likely to vote Conservative than men, and that the switch only occurred in 2005.

Where were the biggest swings from Labour to the Conservatives? Labour fell by 12% among men aged 35-54 while the Conservatives rose by 5% among this group, and there was a 7-point swing from Lab to Con among all 35-54 year olds.

There was also a big swing to the Conservatives among C2 and DE men among whom Labour fell 11% and the Conservatives rose 3% and 7% respectively, though there was a swing from Labour to the Conservatives among every class/gender grouping.

The one demographic group which swung towards Labour was 18-24 year olds, though this was because Con support fell by 8% with the Lab vote share constant. 18-24 year old men swung to Labour by 11 points, while women aged 18-24 actually swung to the Conservatives by 4 points.

Finally, who voted? While turnout estimates should be treated with caution, the enduring pattern of higher turnout among older people and lower turnout among young people has continued in 2019

Data and full write up are here: ipsos.com/ipsos-mori/en-…