@LizSpecht The outbreak of CVOID-19 in China and its spread to the rest of the world is unfolding on an epic scale. Tweeters, bloggers and even mainstream scientists have been predicting Malthusian catastrophe where the virus rapidly infect the world’s population. No less an authority than
@LizSpecht Dr. Ira Longini, an adviser to the World Health Organization (WHO) and co-director of the Center for Statistics and Quantitative Infectious Diseases at the University of Florida, estimated that two-thirds of the world’s population could be infected by COVID-19.
@LizSpecht And Dr. Eric Feigi-Ding, a public health scientist on the faculty at Harvard, warned that nearly a quarter of a million Chinese could be infected by early February.
The “experts” were wrong then, they are wrong now and they will be wrong again. The virus appeared to have been
The “experts” were wrong then, they are wrong now and they will be wrong again. The virus appeared to have been
@LizSpecht contained in China. To reach Dr. Longin’s prediction, 80% of the rest of the world’s population will have to be infected. The total number of cases in China on Feb 15 was 68,347. It is far lower than the 250,000 that was predicted. As of Mar 7, 2020, only about 0.0013% of the
@LizSpecht global population has been infected.
Why are the experts so wrong. They are enamored by infectious disease models which almost invariably predict exponential spread. The last I check every single doomsday prediction based on exponential growth, be it disease spread, Malthusian
Why are the experts so wrong. They are enamored by infectious disease models which almost invariably predict exponential spread. The last I check every single doomsday prediction based on exponential growth, be it disease spread, Malthusian
@LizSpecht famine catastrophe, etc has been wrong. In other words, the experts believed in simple models instead of data. So let’s look at some data.
@LizSpecht In Western-style democracies, South Korea and Italy reported thousands of cases. Other countries in the EU and also Washington state in America are starting to register tens or hundreds of cases as shown in Fig. 1. 
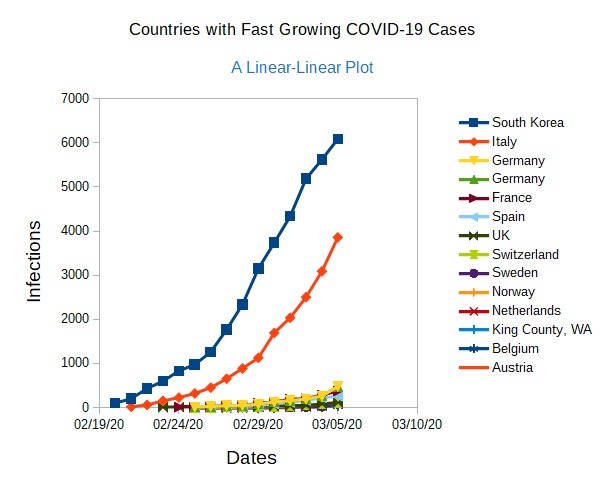
@LizSpecht At first sight, the plots of S. Korea and Italy appear to be somewhat similar whereas the data from other countries are bunched together. A better way to examine these cases is to replot the data as a logarithm-linear graph as shown in Fig. 2.
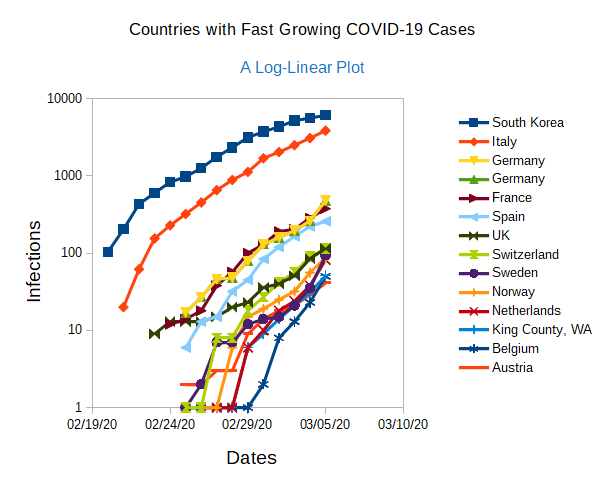
@LizSpecht On such a graph a straight line represents exponential growth. All the infection growths seem to follow a pattern. The slopes of the curve start steep and gradually becomes gentler. What does this mean? It indicates that initial spread is super explosive and the later spread is
@LizSpecht “merely” explosive. Since the first infection case of each county is different. It is instructive to shift all the different countries’ data so that day one represents the first detected case.
@LizSpecht Surprisingly, all the different data collapsed onto a single “universal” curve when the data is shifted to the left or right to extrapolate to day 1 of infection as shown in Fig. 4.
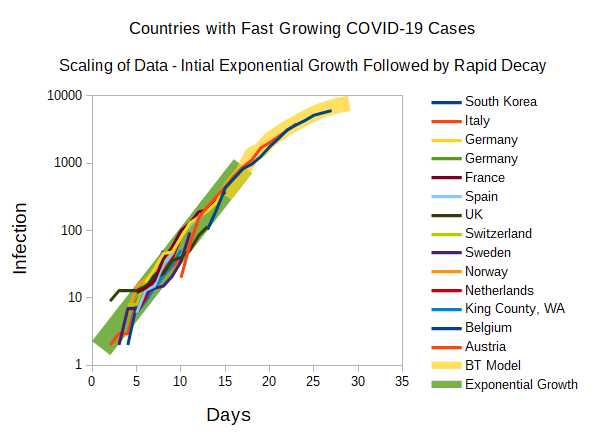
@LizSpecht This “universal” curve for the first fourteen days is approximately a straight line, meaning this is a classic exponential growth.
@LizSpecht A fit (shown by the thick green line) shows that the cases double every 2.57 days. It is worth mentioning that these are detected infections, not actual infections. After that initial fourteen days, the growth curves start to decay and slow down.
@LizSpecht There are two reasons for this decay. One is obviously government intervention or self-imposed quarantine or improved hygiene. The second is less obvious. The model assumes that all infectious individuals will continuously have some chance to infect others even if those other
@LizSpecht people are sitting 6000 miles away from them. This assumption is patently wrong. An infectious individual will most likely infect his family, co-workers and maybe the religious community. After these, such an individual will likely not infect anybody else.
@LizSpecht Since these families, workplaces and communities are somewhat segregated the infections should be in theory confined. The initial exponential growth should thus decay with time even without any intervention.
@LizSpecht The classic SIR (Susceptible, Infectious and Recovered) model or SEIR (Susceptible, Exposed, Infectious and Recovered) model makes the wrong assumption that any Infectious individual is always exploring the entire phase space with some probability of infecting someone else.
@LizSpecht This is what led Dr. Longini or Dr. Feigi-Ding to make predictions that did not and will not pan out. To understand this decay better, a modified SEIR model where the infectious rate (same for both countries) decreases rapidly with time is plotted as the broad yellow curve.
@LizSpecht In this particular case, this new model appears to represent the growth in infections reasonably well. Let’s now focus our attention on detected numbers versus actual numbers.
@LizSpecht First detected numbers are always lower than actual cases and always lag behind the actual numbers in time. Second, the detected numbers strongly depend on the number of test kits available. This means that these detected numbers may just be tracking the increase in available
@LizSpecht test kits. So the initial exponential doubling per 2.57 days for Western-style democracies may be much slower. The consensus among academic studies for COVID-19’s doubling time is about 6 days. However, I will show data below that indicates that this doubling time may fluctuate
@LizSpecht with population density in China. Having looked at uncontrolled growth of the COVID-19 in Western-style democracies, we now turn to a few places that appear to buck the trend of this exponential spread.
@LizSpecht In Hong Kong, Singapore, Taiwan, and Thailand the exponential doubling every 2.57 days lasted for less than a week as shown in Fig.4. From day six to day twenty this doubling time has increased to 10.0 and after three weeks the doubling time became, on average, an astonishing
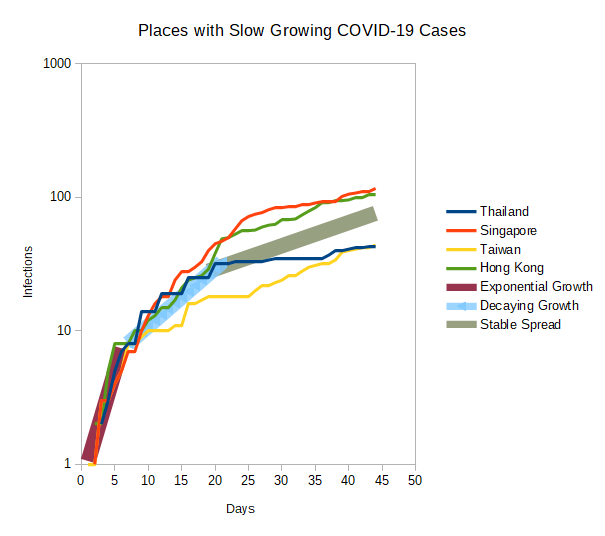
@LizSpecht 25.0 days. What happened? One, in the first few days that cases were detected, Taiwan and Singapore immediately stopped travelers from China. Second, they then implemented carefully orchestrated plans of public education of personal hygiene and distribute masks to all residents.
@LizSpecht Third, they meticulously tested all possible infections. Fourth, they conducted elaborate contact tracing of confirmed cases and quarantine individuals that may be at risk. As opposed to the regions from Fig. 3, Hong Kong, Singapore, Taiwan, and Thailand were able to effectively
@LizSpecht control and suppress the growth of COVID-19. The fight is not yet over though. A single undetected asymptomatic individual who comes into close contact with large numbers of other susceptible people can still wreak havoc in these regions. The author will offer some guidelines as
@LizSpecht to how to model this in a separate article.
While these four regions offer some guidelines for governments during the next global infection crisis it is already too late for many parts of the world. Once infections escalate beyond tens of cases it becomes exponentially more
While these four regions offer some guidelines for governments during the next global infection crisis it is already too late for many parts of the world. Once infections escalate beyond tens of cases it becomes exponentially more
@LizSpecht difficult to conduct contact tracing. Specifically, when the cases in America are examined in Fig. 5, it is easy to conclude that California, New York, and Washington states are experiencing exponential growth.
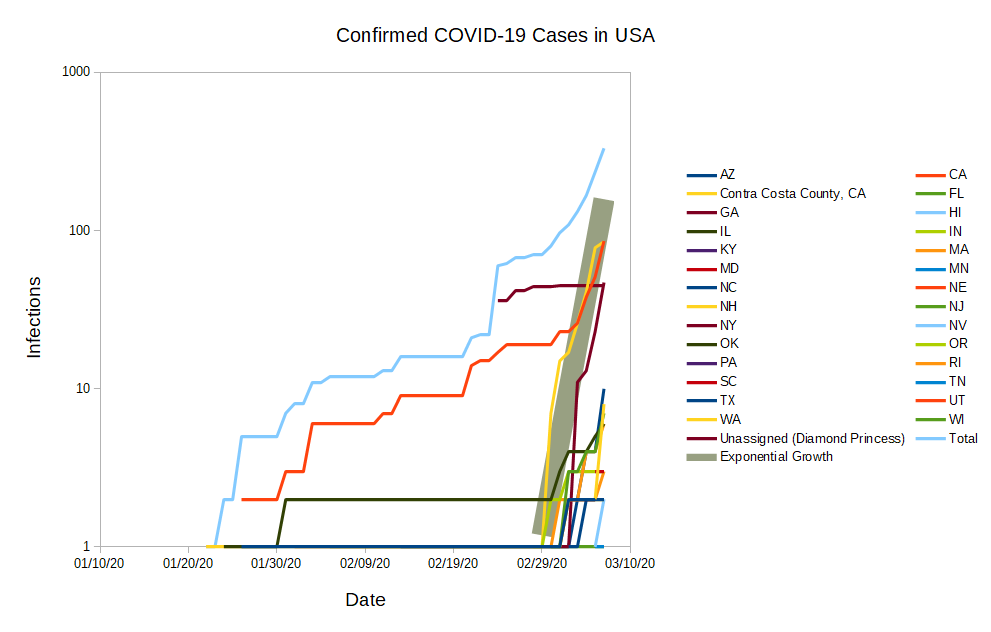
@LizSpecht If infections in these states grow like the Western-style democracies in Fig. 3 then it is predicted that more than 250 cases will be detected separately in Washington and California on Mar 10, 2020, and more than 100 cases will be detected in New York on Mar 9, 2020. These
@LizSpecht numbers will continue to grow dramatically unless draconian measures are implemented immediately.
The author calls out specifically governors of Florida, Hawaii, Illinois, …, Utah, Wisconsin, etc. This is a crisis that required your leadership right now.
The author calls out specifically governors of Florida, Hawaii, Illinois, …, Utah, Wisconsin, etc. This is a crisis that required your leadership right now.
@LizSpecht Your states have less than ten reported cases in Illinois. From the data presented in Figs 3 and 4, this is the time to act! If you wait for more than a few days, the data guarantees catastrophes. Please form task teams NOW to study the measures that Taiwan and Singapore
@LizSpecht introduced. If you can roll out contact tracking and other relevant measures within the next two to three days there is hope that this virus can be slowed down.