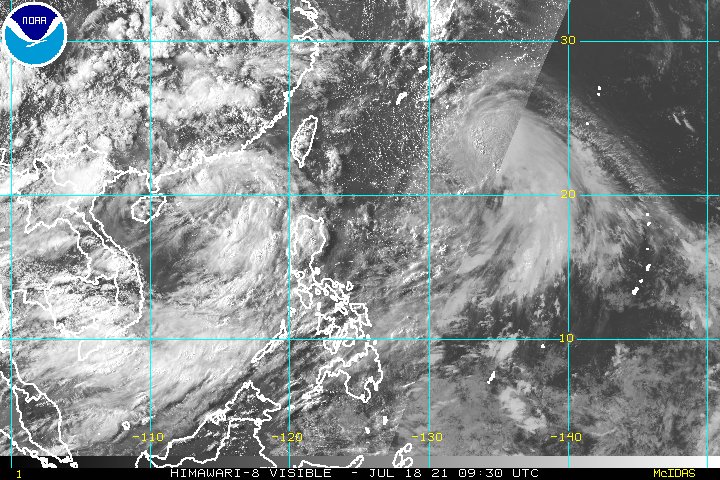
The magnitude of #ArabianMonsoonBurst is now apparent. A major storm is about to cross the Red Sea and arrive in the #HornOfAfrica. Behind it are two enormous super-cell thunderstorms.
Today's rainfall forecasts follow.
Today's rainfall forecasts follow.
The rain activity shown in the @zoom_earth animation preceding is only radar based, Saudi radar, and in this case is complementary to the @Meteoblue satellite rainfall estimates you see below. There is likely significantly more rainfall in this than you see here. 

Here we see India (the heart of this Monsoon), this morning to 10am East Africa Time. I.E. around seven hours ago.
And here a wider view over the Arabian Sea showing the water transport more clearly, which, interestingly is going in both directions. And which may be self reinforcing this process.
The first four GFS PWAT plots today take us to 4am in the morning (they show 10am 4pm 10pm and 4am respectively.
The first thing I notice is there is barely any difference between them. The intensity drops slightly tonight, but that's all.


The first thing I notice is there is barely any difference between them. The intensity drops slightly tonight, but that's all.


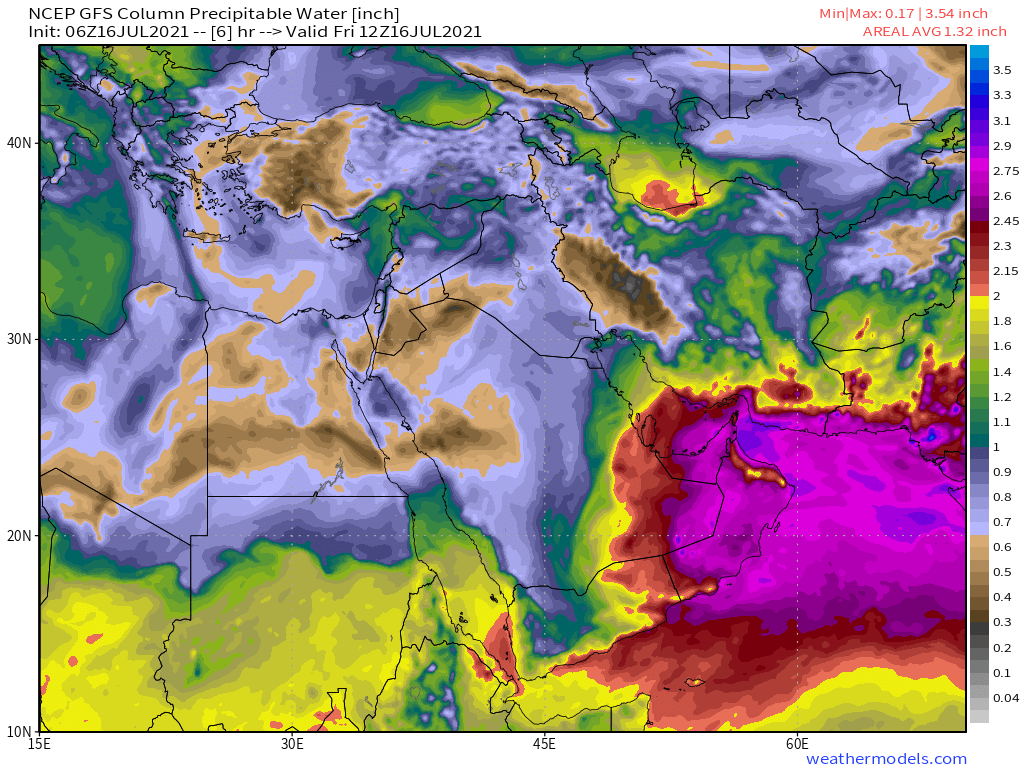

Here we see the GFS simulation of the PWAT parameter for five days in six hour increments. It peaks after 48 hours (Sunday Night) and then falls away. And the primary trajectory of the water seen here is North West up the Gulf of Arabia.
However as we can see in the satellite imagery this is a multi-layered phenomena we are witnessing with water going in multiple different directions.
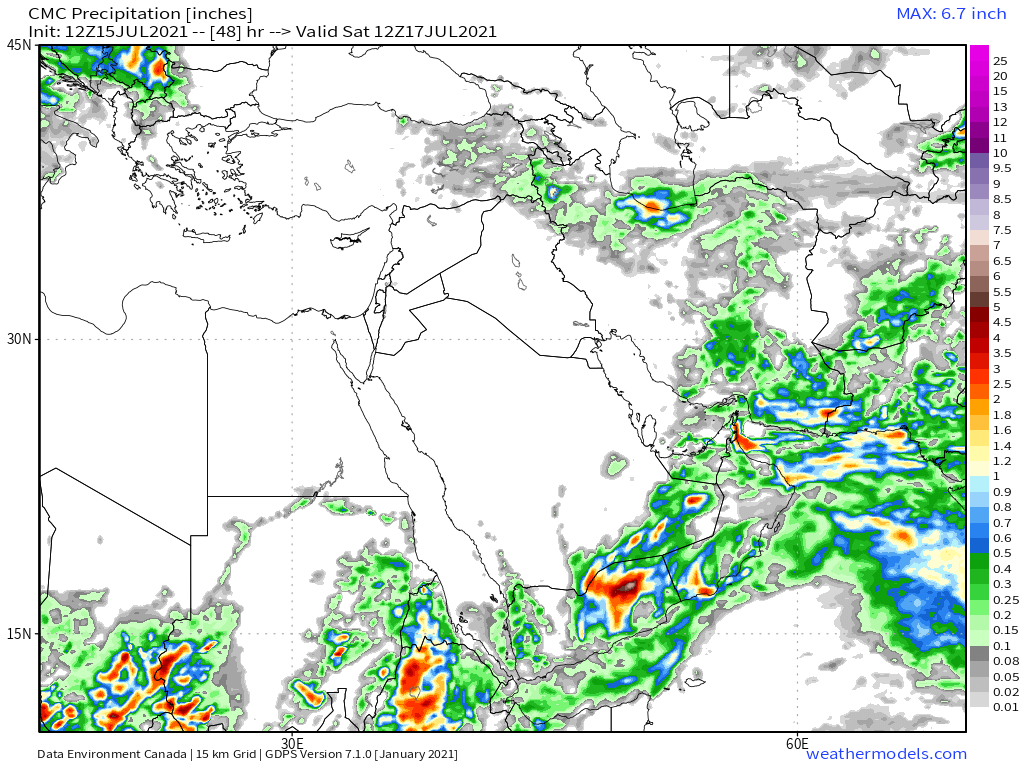
The Canadian CMC version of the same PWAT simulation (five days) is at higher resolution and shows a bit more subtlety. It also seems to more closely match what we are actually seeing today at the front end.
Importantly it doesn't show the event decaying nearly as quickly.
Importantly it doesn't show the event decaying nearly as quickly.
And we have a third-way version from the European @ECMWF model.
Extreme weather events, and this is a spectacular one are extremely difficult to model. And in the end as those who live in the region would say, and God knows best.
الله أعلم
Extreme weather events, and this is a spectacular one are extremely difficult to model. And in the end as those who live in the region would say, and God knows best.
الله أعلم
Today's big picture takes in all of this plus the ongoing extreme rain event in Europe which while much smaller has already claimed more than 100 lives. 

Today's 10-Day Rainfall forecasts for North Africa from July 16th through July 27th. The #ArabianMonsoonBurst can be seen very clearly on the far right of the four accumulated rainfall forecasts. 


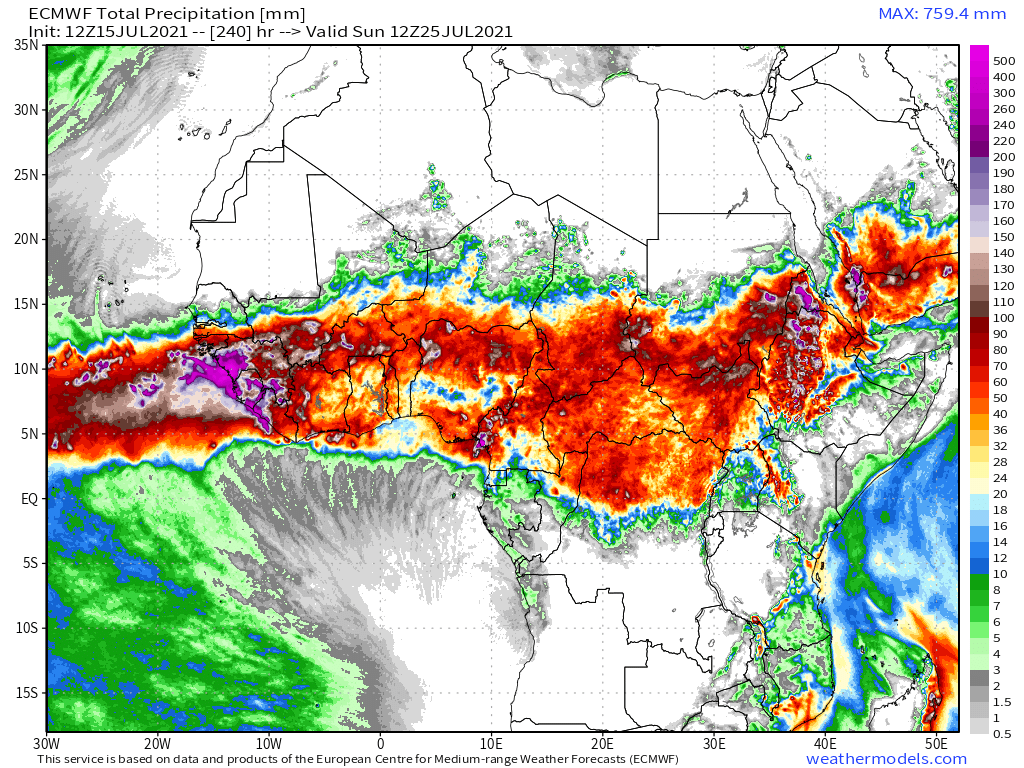

48-hour rainfall forecasts (today and tomorrow from our standard four models: the European @ECMWF, U.S. @NOAA's GFS, Canada's CMC and the Korean KMA models. The last, skinniest, one is the ECMWF. 


And finally for #NorthAfrica we have the long-range 16-day (GFS) and 12-day (KMA) forecasts - which remain remarkably well aligned.
[NOTE: We will have a better view of forecast rain over the southern Arabian Peninsula later in the bulletin.]

[NOTE: We will have a better view of forecast rain over the southern Arabian Peninsula later in the bulletin.]


Today's July 16th 10-day rainfall forecasts for #Ethiopia (+1 12-day from KMA) and the #HornOfAfrica: #Somalia, #Somaliland, eastern parts of #SouthSudan, south eastern parts of Sudan, #Djbouti and #Eritrea.
Purple areas cover #Tigray & the #Abbay (#GERD) #TekezeAtbara basins.


Purple areas cover #Tigray & the #Abbay (#GERD) #TekezeAtbara basins.


48 Hour forecasts (today and tomorrow) from the same three models. Rains are now forecast in west and coastal #Somaliland in the KMA model, which seems plausible. 


A near live view over the area tonight, as of an hour and a half ago. At the bottom you can see Lake Victoria, the source of the White Nile. This image covers all of the Nile's rainfall basins. 

And today's final @zoom_earth satellite animation shows the #ArabianMonsoonBurst at sunset.
[Link to view this area live: zoom.earth/#view=16.8,47.…]
[Link to view this area live: zoom.earth/#view=16.8,47.…]
July 16th 10-Day accumulated rain forecasts for the #MiddleEast from the GFS, CMC, KMA & ACG weather models.
#ArabianStorms
#KSA #Yemen #Oman #Jordan #Sudan #Iran #Syria #GERD #Sudan #DesertRain #UAE
الله أعلم


#ArabianStorms
#KSA #Yemen #Oman #Jordan #Sudan #Iran #Syria #GERD #Sudan #DesertRain #UAE
الله أعلم


48 Hour July 14th (today and tomorrow), accumulated rain forecasts for the #MiddleEast from the GFS, CMC, KMA and ECMWF weather models.
#ArabianStorms
#KSA #Yemen #Oman #Jordan #Sudan #Iran #Syria #GERD #Sudan #DesertRain
الله أعلم


#ArabianStorms
#KSA #Yemen #Oman #Jordan #Sudan #Iran #Syria #GERD #Sudan #DesertRain
الله أعلم


And finally we have today's long-range #MiddleEast July 14th rainfall forecasts.
The16-day GFS & GEFS models, the 12 day KMA and the 15 day EPS (Euro ensemble) model forecasts.
UAE rainfall is in the frame in all models & as we saw earlier it is already getting it.
الله أعلم


The16-day GFS & GEFS models, the 12 day KMA and the 15 day EPS (Euro ensemble) model forecasts.
UAE rainfall is in the frame in all models & as we saw earlier it is already getting it.
الله أعلم

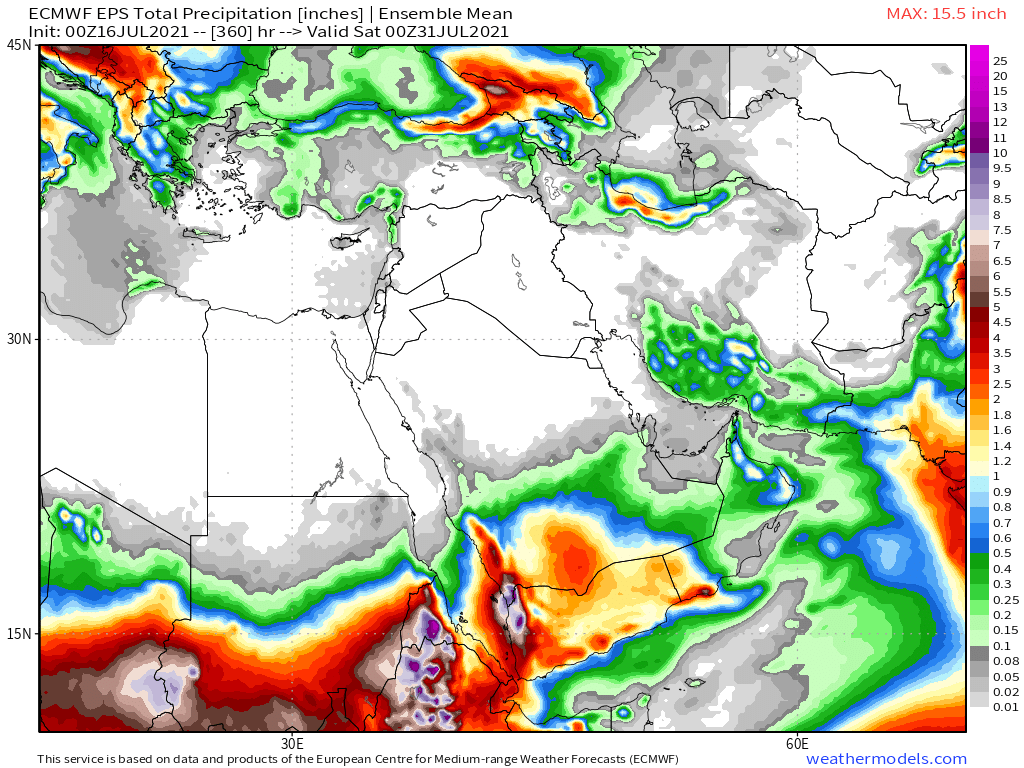

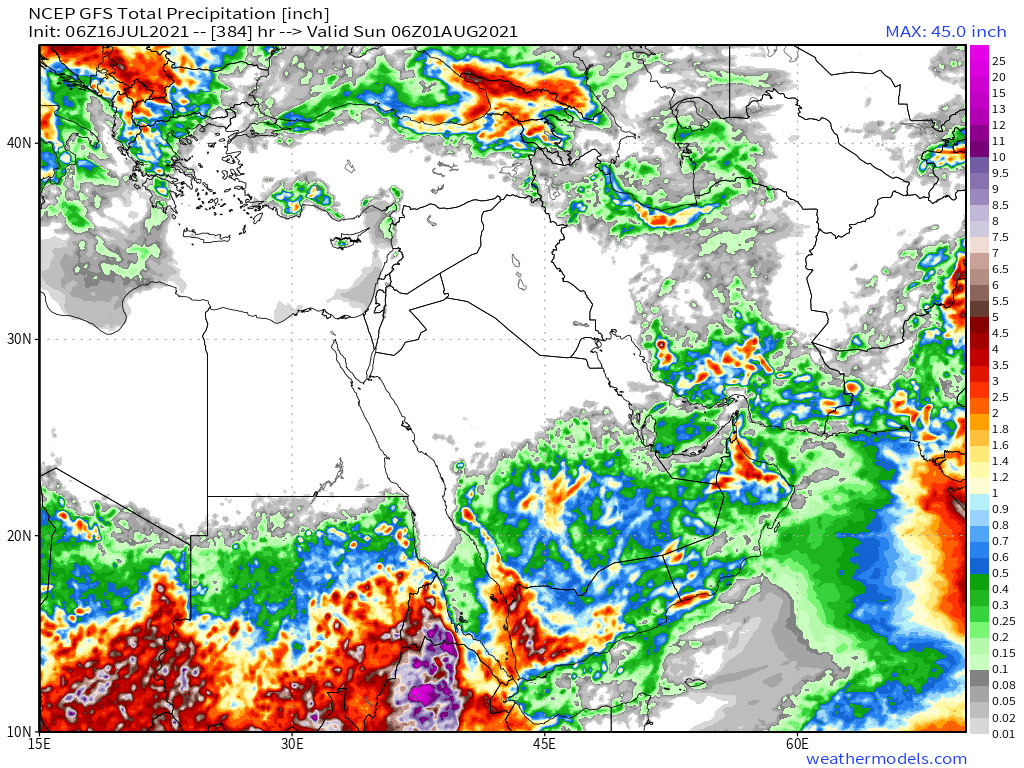
The GFS (latest complete run) is now the simulation showing the least amount of rain among all these models over 16 days. It will be interesting if the ohter models come into line on this.
NOTE: The GFS has far and away the most sophisticated and tested global model at present.
NOTE: The GFS has far and away the most sophisticated and tested global model at present.
/ENDS
@Threadreaderapp unroll
@Threadreaderapp unroll
... threadfix --->>
https://twitter.com/althecat/status/1416064439024033795?s=20
• • •
Missing some Tweet in this thread? You can try to
force a refresh


