*THREAD* Useful Patterns for beginners and experienced traders
Triple Bottom:
Prolonged downtrend,bears in control.
Should be an existing downtrend before pattern occurs.
The 3 lows price should be roughly same. Vol decreasing.
3rd bottom shows strong support. Possible uptrend.
Triple Bottom:
Prolonged downtrend,bears in control.
Should be an existing downtrend before pattern occurs.
The 3 lows price should be roughly same. Vol decreasing.
3rd bottom shows strong support. Possible uptrend.

Bull Flag:
Found in strong uptrends.
Horizontal rectangle often angled down away from the main trend. Psychology is despite a strong vertical rally, price refuses to drop appreciably, bulls snap up any shares they can get.
Powerful move higher = length of the prior flag pole
Found in strong uptrends.
Horizontal rectangle often angled down away from the main trend. Psychology is despite a strong vertical rally, price refuses to drop appreciably, bulls snap up any shares they can get.
Powerful move higher = length of the prior flag pole

Cup and Handle:
Considered a bullish continuation pattern.
Cups with longer, more "U" shaped bottoms provide a stronger signal. Avoid cups with a sharp "V" bottoms.
Handles should form in the top 1/2 of the cup pattern.
Stop buy order slightly above upper trend line of handle
Considered a bullish continuation pattern.
Cups with longer, more "U" shaped bottoms provide a stronger signal. Avoid cups with a sharp "V" bottoms.
Handles should form in the top 1/2 of the cup pattern.
Stop buy order slightly above upper trend line of handle

Head and Shoulders:
Bullish-to-bearish trend reversal.
Price reaches 3 consecutive lows, separated by temporary rallies
The 2nd trough is the lowest (the head) and the 1st and 3rd are slightly shallower (the shoulders).
Line connecting 1st + 2nd trough is called the neckline.
Bullish-to-bearish trend reversal.
Price reaches 3 consecutive lows, separated by temporary rallies
The 2nd trough is the lowest (the head) and the 1st and 3rd are slightly shallower (the shoulders).
Line connecting 1st + 2nd trough is called the neckline.

Inverse Head and Shoulders:
Reversal of downtrend,enter long when price rises above resistance of neckline
watch for a large spike in volume to confirm breakout.
Breakout validated if price closes above neckline.
profit projection = distance between bottom of head and neckline
Reversal of downtrend,enter long when price rises above resistance of neckline
watch for a large spike in volume to confirm breakout.
Breakout validated if price closes above neckline.
profit projection = distance between bottom of head and neckline

Round Bottom:
long-term reversal,suited for weekly charts
represents a long consolidation that turns from a bearish bias to bullish
Bullish confirmation:pattern breaks above high that marked the beginning of decline at the start of the pattern
Vol matches prices decline and rise
long-term reversal,suited for weekly charts
represents a long consolidation that turns from a bearish bias to bullish
Bullish confirmation:pattern breaks above high that marked the beginning of decline at the start of the pattern
Vol matches prices decline and rise

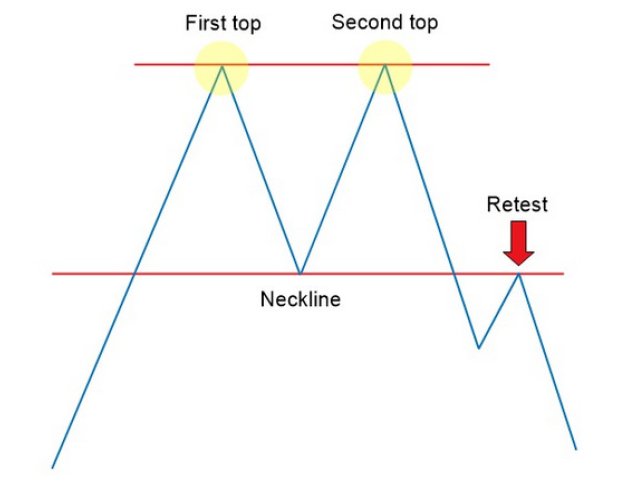
Double Top:
price peaked in same area twice, unable to move above resistance area. Forms a
high within an uptrend, and then pulls back. On the next rally the price peaks near the prior high.
take short positions or exit long positions—when the price drops below the pullback low
price peaked in same area twice, unable to move above resistance area. Forms a
high within an uptrend, and then pulls back. On the next rally the price peaks near the prior high.
take short positions or exit long positions—when the price drops below the pullback low
Ascending Triangle:
Bullish pattern.
one trend line is drawn horizontally at a level that historically prevented price from heading higher,second trend line connects a series of increasing troughs.Traders enter long positions when price breaks out from the horizontal trendline
Bullish pattern.
one trend line is drawn horizontally at a level that historically prevented price from heading higher,second trend line connects a series of increasing troughs.Traders enter long positions when price breaks out from the horizontal trendline

Falling Wedge:
Bullish reversal.
begins wide at the top and contracts as prices move lower.
at least two highs to form the upper resistance line, same with support line.
Vol expansion is essential to validate a breakout above resistance.
Bullish reversal.
begins wide at the top and contracts as prices move lower.
at least two highs to form the upper resistance line, same with support line.
Vol expansion is essential to validate a breakout above resistance.

Symmetrical Triangle:
represents consolidation before price is forced to breakout/breakdown.
price target for a breakout/breakdown is equal to the distance from the high and low of the earliest part of the pattern added to the breakout price
Stop loss just below breakout price.
represents consolidation before price is forced to breakout/breakdown.
price target for a breakout/breakdown is equal to the distance from the high and low of the earliest part of the pattern added to the breakout price
Stop loss just below breakout price.