Closing the loop on #Diagnostics #Tweetorial with example #AppleWatch #AFib #Screening. From a company website: "Atrial fibrillation is a silent killer. The heart arrhythmia causes more life-threatening strokes than any other chronic condition, and will affect 1 in 4 of us."
"But the sad fact is that atrial fibrillation often goes unnoticed: It is estimated that 40% of those who experience the heart condition are completely unaware of it."
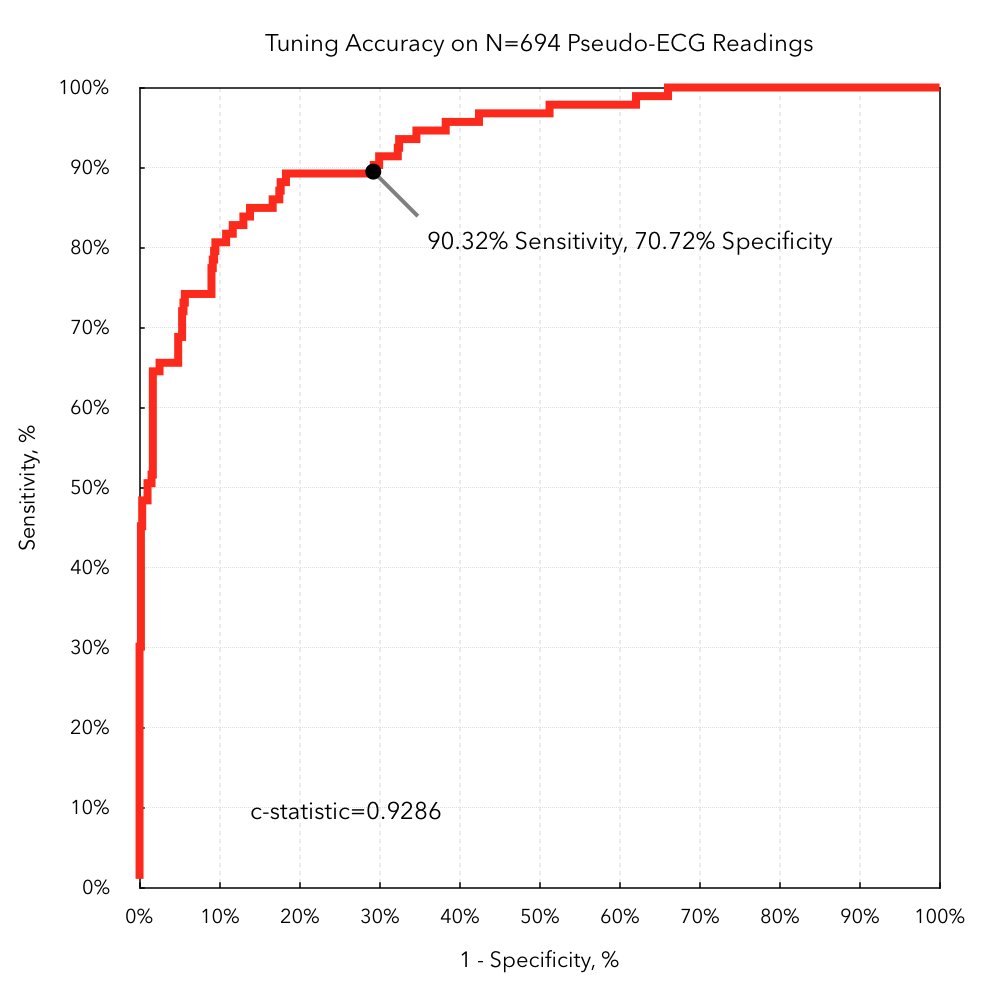
Using #AppleWatch technology and #DeepLearning #AI #ML, a device algorithm can reportedly detect atrial fibrillation with high accuracy (c-statistic 93%).
If a 50 year old asymptomatic tech CEO comes into your office demanding additional testing because his watch just told him he has #Afib. What would you do?
Simpler question first. What are the chances that this man has atrial fibrillation?
Unlike my previous poll on "Medicine's Uncomfortable Relationship With Math," "I don't know" is probably the best answer, because the information above is insufficient (if not overtly misleading).
"1 in 4" likely refers to total lifetime incidence, even if that means you had Afib for 1 day when you were 90 years old. Not really relevant if you're screening a 50 year old. Age-based prevalence makes more sense. jamanetwork.com/journals/jamai… 
Another true, but misleading statement. "40% with Afib are unaware of it." Readers may fear they have 40% chance of Afib even if asymptomatic. I.e., P(Afib|Asymptomatic) = 40%. Not even a little bit close. The prior statement means P(Asymptomatic|Afib) = 40%.
Deceptive to refer to c-statistic = area under receiver operating characteristic curve (AUROC) as "accuracy" (not that total accuracy is better). People hear "93% accurate," so if I get a positive result, then 93% certain I have the disease! 😱 Ugh. Wrong.
C-statistic = AUROC is commonly used to evaluate predictive/diagnostic algorithms, but is similar to sensitivity/sensitivity in not considering pre-test probability (e.g., baseline prevalence = base-rate).
C-statistic = AUROC specifically avoids defining a particular sensitivity/specificity cutoff, instead reporting the tradeoff across a range of values. To do an actual decision calculation though, we'll need to pick a threshold.
ROC plot shows point with 90% sensitivity and 70% specificity. Strange to pick as the "top-left corner" is best, so the algorithm could perform strictly better by moving left along the curve and still achieve 90% sensitivity, but with 80% specificity.
blog.cardiogr.am/detecting-atri…
blog.cardiogr.am/detecting-atri…
With the above graphs, we can now calculate a risk of Afib given the watch detection for our otherwise healthy 50-year old. Now what would you tell this person their chance of having Afib is?
- 90% sensitivity
- 80% specificity
- 0.5% age-based prevalence
- 90% sensitivity
- 80% specificity
- 0.5% age-based prevalence
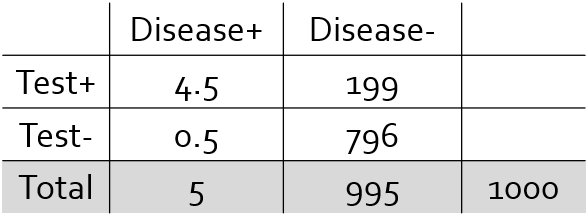
Many realize they're trying to calculate positive predictive value (PPV) = post-test probability, and will try to fill in a 2x2 contingency table to figure it out. Beware if you fill out like this, and end up with PPV = 90/(90+20) = 82%.
Integrate pre-test probability into this calculation. If nothing else to go off, then baseline prevalence is reasonable. Make sure the rows and columns add up to the relative prevalence ratios (5 out of 1000 people have Afib at 50 years old).
Based on the above PPV = 4.5 / (4.5+199) = 2.2%. Yes, when this 93% accurate test thinks you have a disease, there's only a *2% chance* it is correct.
True but deceptive? This patient has >400% greater risk of disease than the general population! Yes, 2.2% is >4x 0.5%, but tougher question is whether we can effectively treat someone with 2% risk much differently than those with 0.5% risk. jamanetwork.com/journals/jamai…
Writing things in terms of conditional probability helps me think it through.
Sensitivity = P(Test+ | Disease+)
Specificity = P(Test- | Disease-)
Prevalence = P(Disease+)
Positive Predictive Value = P(Disease+ | Test+)
Negative Predictive Value = P(Disease- | Test-)
Sensitivity = P(Test+ | Disease+)
Specificity = P(Test- | Disease-)
Prevalence = P(Disease+)
Positive Predictive Value = P(Disease+ | Test+)
Negative Predictive Value = P(Disease- | Test-)
Our prior screening examples illustrate why sensitivity and specificity are very backwards in terms of applied thinking. Sensitivity: Given that you have the disease, what is the probability that the test will be positive.
If you already knew you had the disease, why would we bother to test you!? In clinical decision making, almost always what you actually care about is positive and negative predictive values, the chance that a given test result is correct.
People report sensitivity and specificity as "intrinsic" properties of a test, because they will not vary depending on pre-test probability. The positive predictive value for our 50 year old is quite different than for an 80 year old, even though the test is the same.
Another approach is likelihood ratios, which indicate how much to change your diagnostic estimates given a test result.
Positive Likelihood Ratio (LR+) = Sensitivity / (1-Specificity)
Negative Likelihood Ratio (LR-) = (1-Sensitivity) / Specificity
Odds Ratio = LR+/LR-
Positive Likelihood Ratio (LR+) = Sensitivity / (1-Specificity)
Negative Likelihood Ratio (LR-) = (1-Sensitivity) / Specificity
Odds Ratio = LR+/LR-
The prior example assumed we know nothing about the patient, so baseline prevalence = pre-test probability. The test isn't right or wrong, it just "provides information." We would ask the patient about symptoms, family history, etc. that would all affect our diagnostic estimate.
How do you incorporate multiple (independent) pieces of information? Say we checked the patient for genetic variants that are predictive of disease. What if both tests are positive? What if one is positive and the other is negative?

Assuming the tests are independent, you can basically use the post-test probability (e.g., positive predictive value if the test result was positive) from one test as the pre-test probability (instead of prevalence) for the next test.
We've already seen how high sensitivity/specificity numbers can be misleading towards high PPV/NPV estimates. Translating into likelihood ratios allows you to directly calculate post-test probabilities from pre-test probabilities.
Pre-test Odds = Pre-test Prob / (1 - Pre-test Prob)
Post-test Odds = Pre-test Odds x Likelihood Ratio
(Use LR+ or LR- depending on test result)
(Can chain together product of multiple LRs)
Post-test Prob = Post-test Odds / (1 + Post-test Odds)
Post-test Odds = Pre-test Odds x Likelihood Ratio
(Use LR+ or LR- depending on test result)
(Can chain together product of multiple LRs)
Post-test Prob = Post-test Odds / (1 + Post-test Odds)
Another way to write Pre-Test Odds
P(Disease+)
--------------
P(Disease-)
P(Disease+)
--------------
P(Disease-)
If a test were positive, see what happens when we multiply the pre-test odds by the positive likelihood ratio.
P(Disease+) x P(Test+|Disease+)
-------------------------------------
P(Disease-) x P(Test+|Disease-)
P(Disease+) x P(Test+|Disease+)
-------------------------------------
P(Disease-) x P(Test+|Disease-)
Apply Bayes' rule to the above and you'll find that it's the equal to
P(Disease+|Test+) * P(Test+)
---------------------------------
P(Disease-|Test+) * P(Test+)
en.wikipedia.org/wiki/Bayes%27_…
P(Disease+|Test+) * P(Test+)
---------------------------------
P(Disease-|Test+) * P(Test+)
en.wikipedia.org/wiki/Bayes%27_…
The P(Test+) term cancels out, so you'll end up with the post-test odds
P(Disease+|Test+)
---------------------
P(Disease-|Test+)
P(Disease+|Test+)
---------------------
P(Disease-|Test+)
Don't forget to convert into a probability at the end!
P(Disease+|Test+) = Post-Test Odds / (Post-Test Odds + 1)
P(Disease+|Test+) = Post-Test Odds / (Post-Test Odds + 1)
Redoing our prior screening example
Pre-Test Probability = 0.5%
Pre-Test Odds = 5:995 ~ 0.005
Positive Likelihood Ratio = 0.90/(1-0.80) = 4.5
Post-Test Odds = 0.005 * 4.5 = 0.0225
Post-Test Probability = Positive Predictive Value = 0.0225 / (0.0225+1) ~ 2.2%
Pre-Test Probability = 0.5%
Pre-Test Odds = 5:995 ~ 0.005
Positive Likelihood Ratio = 0.90/(1-0.80) = 4.5
Post-Test Odds = 0.005 * 4.5 = 0.0225
Post-Test Probability = Positive Predictive Value = 0.0225 / (0.0225+1) ~ 2.2%
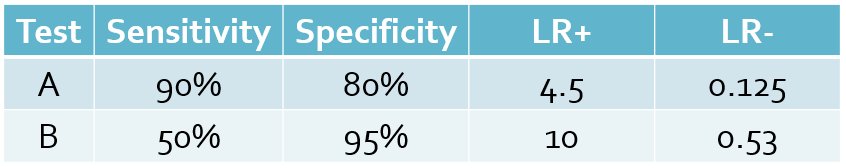
What if test A is positive but test B is negative?
Pre-Test Odds ~ 0.005
Positive Likelihood Ratio (Test A) = 0.90/(1-0.80) = 4.5
Negative Likelihood Ratio (Test B) = (1-0.50)/0.95 = 0.53
Post-Test Odds = 0.005 x 4.5 x 0.53 = 0.012
Post-Test Prob = 0.012 / (0.012+1) ~ 1.2%
Pre-Test Odds ~ 0.005
Positive Likelihood Ratio (Test A) = 0.90/(1-0.80) = 4.5
Negative Likelihood Ratio (Test B) = (1-0.50)/0.95 = 0.53
Post-Test Odds = 0.005 x 4.5 x 0.53 = 0.012
Post-Test Prob = 0.012 / (0.012+1) ~ 1.2%
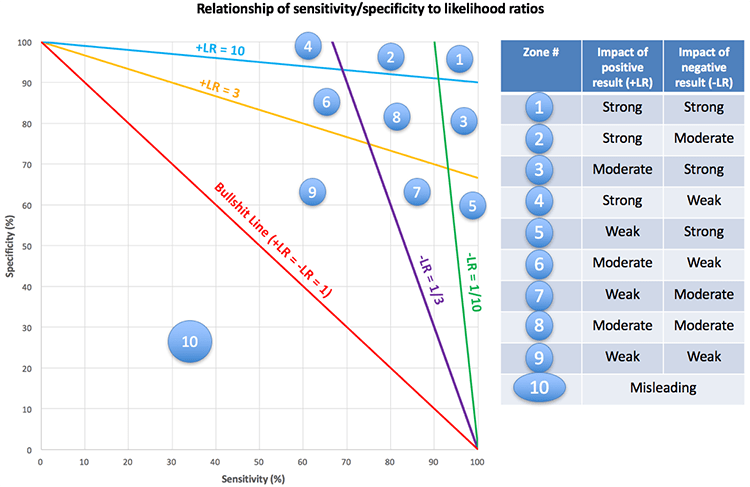
In medicine, we learn about tests being "Sensitive, but not Specific," that should make for a good "screening" test (Test C?). In contrast, "Specific, but not Sensitive," makes for a good "confirmatory" test or "pathognomonic sign" (Test D?).

If you calculate the likelihood ratios for the above however, you'll find that they are exactly 1, which means they are exactly worthless. They have no ability to change your post-test probability.
A good positive likelihood ratio should be much larger than 1, while a good negative likelihood ratio should be much smaller than 1 (approaching 0). Odds Ratio = LR+/LR-, so the odds ratio defines a bound on how good either the LR+ or LR- can be.
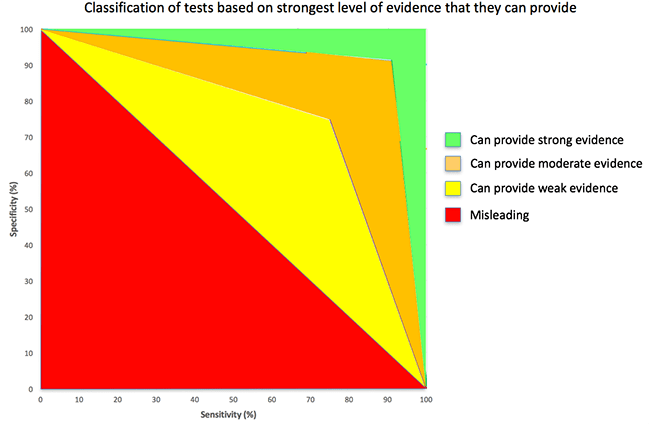
Figures from a helpful blog to illustrate the useful ranges for a diagnostic/screening test that requires both the sensitivity and specificity to be high.
emcrit.org/pulmcrit/mythb…
emcrit.org/pulmcrit/mythb…
Next time I'll tackle the #flushot, relative vs. absolute risk reductions, and number needed to treat.


@threadreaderapp Please unroll