In this thread will try and cover What is Money Flow Index & how to read the Money Flow Index and It's importance in Stock Investing - I repeat it's Investing Only.
Will explain the concept and post few examples.
Retweet is your Choice and not compulsion.
It has a range of 0 to 100.
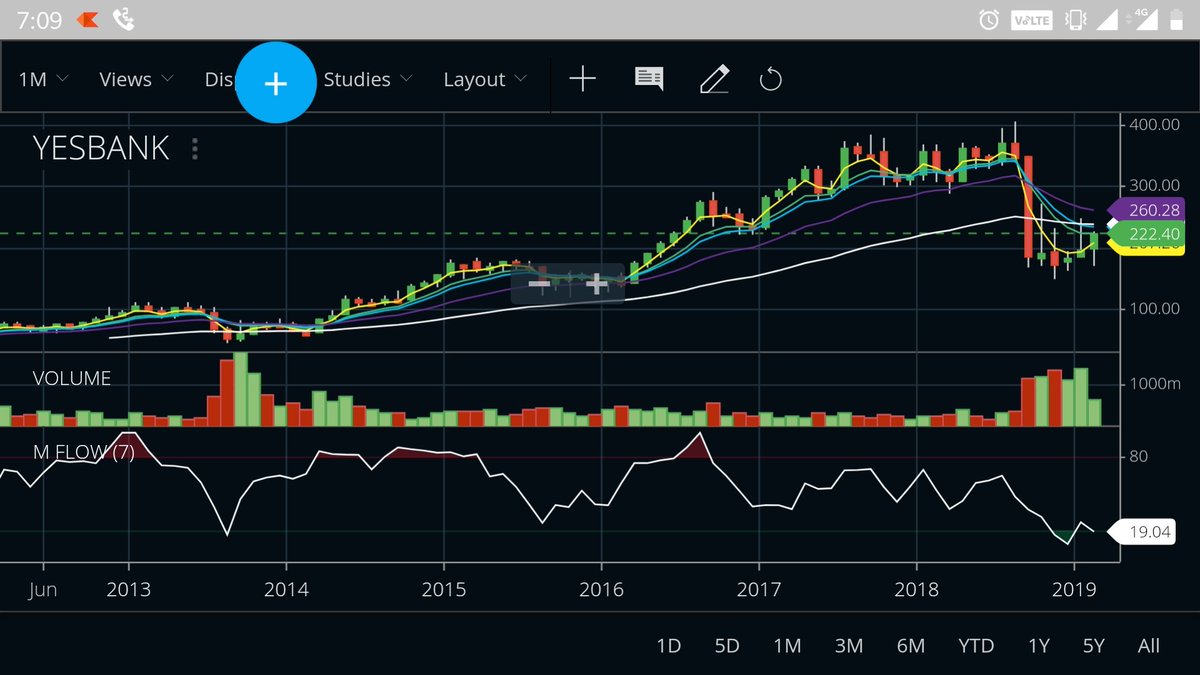
Where below 20 being considered as Over Sold Zone and Above 80 being considered as Over Bought Situation.
But if Price comes down and MFI also moves down then fall comes
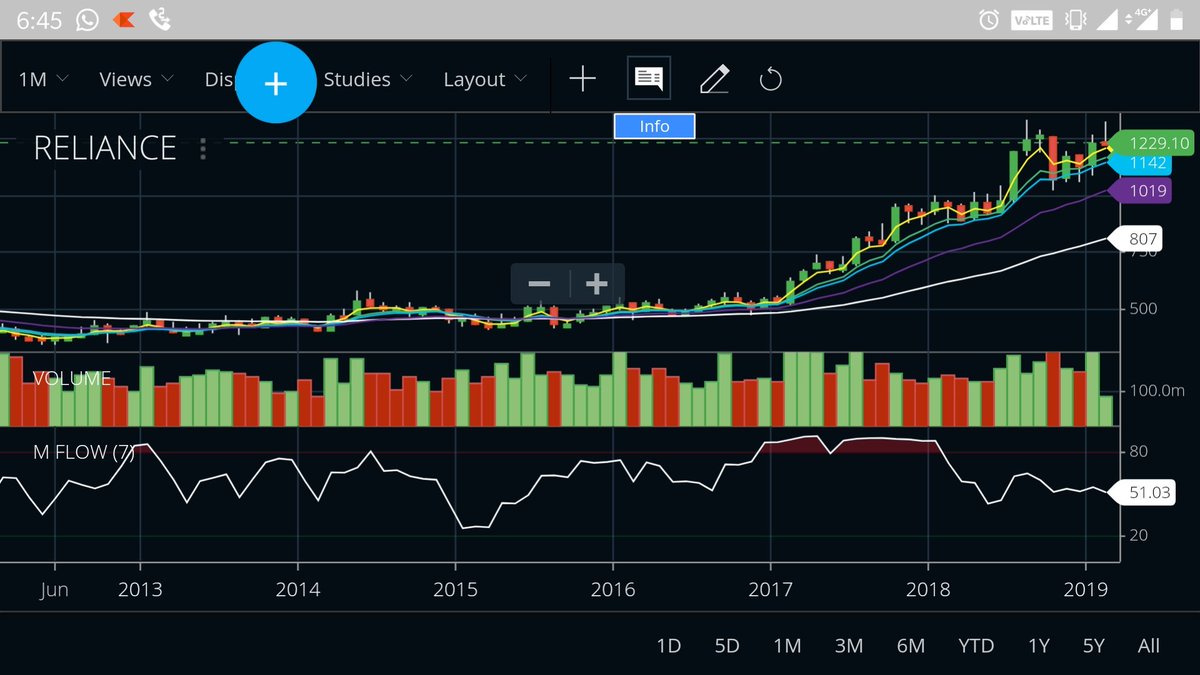
Red zone on Top is Over Bought , then we see Rise In Price but MFI going down and stabilising. This shows that the rise was created and money has actually moved out on rally.
So this clarifies how Nifty is managed by RIL.
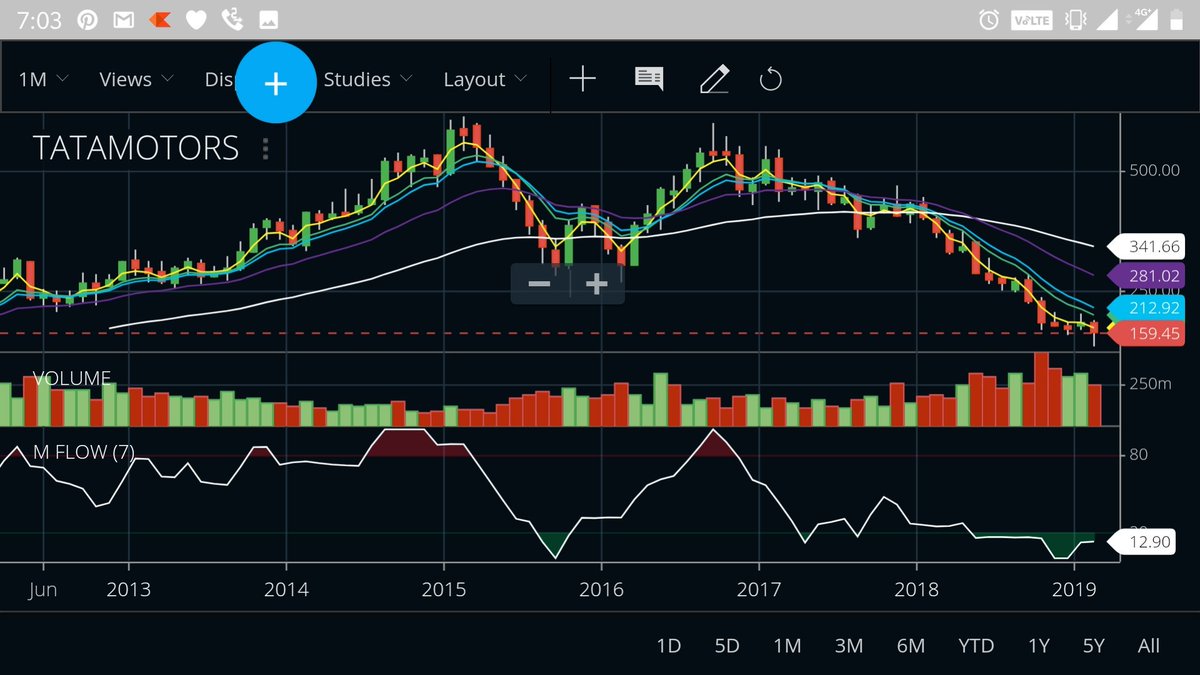
Price fell , over sold zone indicated consolidation and buying. (Green Zone).
One should expect a reversal, considering the over selling some in this counter.
Explanations are purely basis my Observation of Money Flow Index with Price Action and basis that I have written about it.
Technical books might not necessarily give similar explanations.
Thank You for reading and following.
Despite the rise in Price, the Monthly MFI indicates Money flowing Out. While Daily till yesterday MFI close showed Money Flowing In for last One Week and Today we saw the News and the Move in Price. So at higher levels people may take exit calls.
