,
38 tweets,
10 min read
Read on Twitter
1/ An Executive Summary (in Tweet form) of our new paper
Dual Momentum – A Craftsman’s Perspective
Download here:
investresolve.com/global-equity-…
Everything that follows in this thread is based on HYPOTHETICAL AND SIMULATED RESULTS.
Dual Momentum – A Craftsman’s Perspective
Download here:
investresolve.com/global-equity-…
Everything that follows in this thread is based on HYPOTHETICAL AND SIMULATED RESULTS.

2/ Our objectives were twofold:
1.Verify the strength and robustness of the Dual Momentum concept and specifically the Global Equity Momentum strategy
2.Describe how to use ensemble methods to preserve expected performance while minimizing the probability of adverse outcomes
1.Verify the strength and robustness of the Dual Momentum concept and specifically the Global Equity Momentum strategy
2.Describe how to use ensemble methods to preserve expected performance while minimizing the probability of adverse outcomes
3/ Global Equity Momentum (GEM) was formalized by @GaryAntonacci in 2012. The strategy relies on the equity risk premium and two known style premia, trend and momentum, to rotate between U.S. and foreign stocks while moving to bonds when U.S. stocks exhibit a negative trend.
4/ GEM produced attractive performance since 1950 in simulation. We replicated the original research using close data proxies. Our results tracked published results very closely despite minor differences in how we constructed our index of foreign stocks.

5/The Original GEM strategy was specified with a 12-month lookback period to measure both trend and momentum, consistent with prior literature on these effects. Many articles have also observed trend and momentum effects for shorter and longer horizons from 1-18 months or longer.
6/ We examined GEM strategies specified with all possible combinations of absolute and relative momentum formed on 1-18 month lookbacks. With 18 possible parameterizations of trend lookbacks and 18 possible momentum lookbacks, there are 324 possible strategy combinations.
7/ Moreover, trend and momentum can be measured in many ways. In addition to total return, investors have used price relative to moving averages, dual and triple MA crosses, breakouts, and risk-adjusted measures.
8/ We added a price versus moving average cross strategy to our investigation alongside the original time-series approach. Specifically, we measured momentum as the percentage difference between the current price of the market and a moving average formed on 2-18 month MAs.
9/ The Original GEM applied a trend overlay exclusively on the S&P 500 to signal a move from stocks into bonds. We also examined strategies that required both the S&P 500 and foreign stocks to be in a negative trend before moving into bonds.
9/ The Original GEM applied a trend overlay exclusively on the S&P 500 to signal a move from stocks into bonds. We also examined strategies that required both the S&P 500 and foreign stocks to be in a negative trend before moving into bonds.

11/ We tested the null hypothesis that there is no statistical difference between the performance of the Original GEM strategy and the other 1225 alternative specifications. This chart plots the wealth trajectory for all 1226 GEM specifications on the same chart.

12/ The yellow line at the bottom and the red line at the top above trace the 5th and 95th percentile wealth trajectory at each point in time over the sample period from 1950 – 2018. The Original strategy (emphasized dark blue line) was below the 95th percentile at all horizons.
13/The realized trajectory of performance above reflects the exact sequence of events that shaped the performance of markets in the past. It’s important to examine the distribution of possible “alternative histories” since markets will take a different path in the future.
14/ We performed a “block bootstrap” to observe other potential paths that returns might have taken while preserving the empirical distribution of the original strategies. We plot 1,000 bootstrapped wealth trajectories as a Quantile Cloud below.
See also investresolve.com/blog/winning-b…
See also investresolve.com/blog/winning-b…
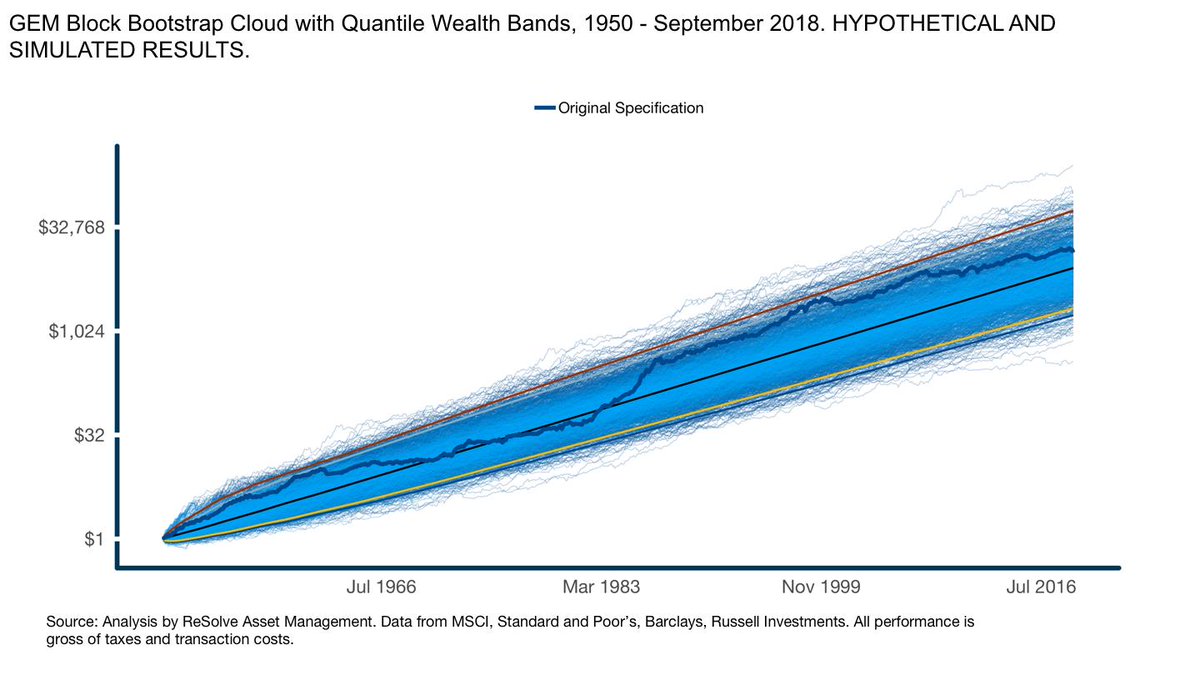
15/ While the Original specification (traced by the thick dark blue line) achieved a lucky outcome in-sample, the wealth trajectory is well below the 95th percentile red line. So we have no reason to believe it is “special” from a statistical sense.
16/ When we performed a formal block bootstrap analysis to test if there was a stat sig difference in annualized returns between the Original strategy and our other 1225 specifications we found that the Original specification only outperformed 61% of the time – random luck.
17/ We performed the same test to see if any alternative specifications exhibited stat sig under- or out-performance and found that we can’t reject the hypothesis that they all have the same expected compound means and Sharpe ratios.
It seems ALL SPECIFICATIONS HAVE EQUAL MERIT.
It seems ALL SPECIFICATIONS HAVE EQUAL MERIT.
18/ If all specifications have equal merit, then we expect the performance of any particular specification to converge on the median performance across all specifications over the long-term.
19/ We put this theory to the test by examining the performance of the Original specification in the out-of-sample period (1950-1973 and 2012-2018) not examined in the original study. As expected, performance of the Original strategy regressed to the median out of sample.

20/ While all 1226 specifications are expected to produce the same performance in the future, choice of specification introduces an *uncompensated* source of risk. Different specifications will often hold different portfolios through time.
21/ These subtle differences from month to month can produce very significant economic consequences over intermediate horizons. For example, the mean difference in 5-year cumulative returns bw the most and least lucky specifications is 64 percentage points.

22/ A simple way to minimize uncompensated specification risk is to combine signals from all specifications by building an ENSEMBLE strategy. The ensemble should preserve the expected performance of the GEM strategy, but produce returns with greater stability.
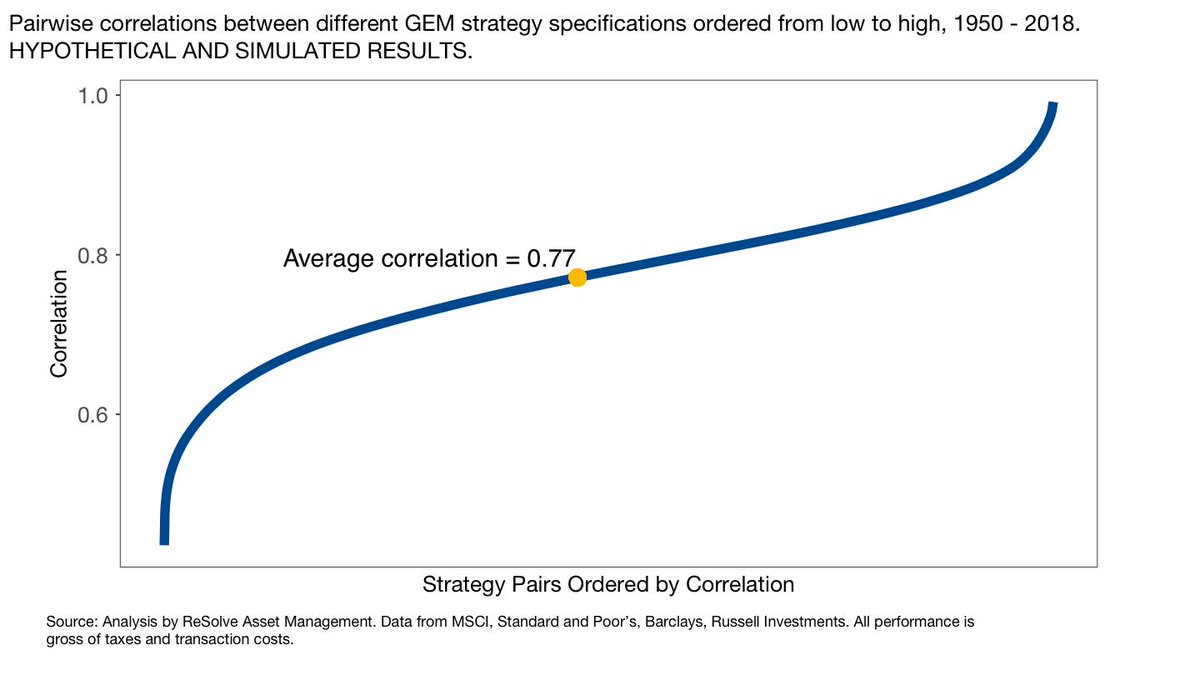
23/ The ensemble takes advantage of a surprising amount of diversity in monthly returns across the different strategy specifications. The average pairwise correlation between strategy pairs has been just 0.77 and 25% of strategy pairs have exhibited correlations below 0.7.
24/ If the 1226 specifications have equal expected performance but offer diversification benefits we should expect an ensemble strategy to preserve the expected performance of the GEM approach, but produce those returns with greater stability.
25/ This means that investors with finite investment horizons and random inception and termination dates will probably come closer to realizing their target return, with a much smaller risk of adverse outcomes.
26/ From a financial perspective this translates to greater portfolio sustainability, higher potential withdrawal rates, and a smaller range of terminal wealth.
27/ Behaviourally, investors will probably be more likely to stick with an ensemble strategy because there is a smaller chance of large drawdowns and/or long periods of underperformance, which might challenge investors’ resolve at precisely the wrong time.
28/ In the paper we demonstrated the improved stability of ensemble strategies in a variety of ways by focusing on the expected frequency and magnitude of outcomes that fall well below most investors’ expectations.
29/ For example, the ensemble strategy dominated almost all specifications in terms of drawdowns. We plot average of losses from the 5 worst drawdowns for all 1226 specifications from 1950 – 2018. The median strategy lost an average of 17.4% while the ensemble lost just 13.2%.

30/ The Martin Ratio measures excess returns relative to the total cumulative amount of pain experienced by an investor accounting for both the length and depth of drawdowns. The ensemble produced almost 40% more "gain" relative to "pain" than a typical individual specification.

31/ It is instructive to observe the expected loss for a strategy in the event of bad luck. The ensemble strategy exacted a 4.7% average annualized loss in its worst 5 calendar years while we might expect a typical individual specification to inflict a 7.5% loss.

32/ The paper examined a variety of other methods to quantify the relative stability of the ensemble approach relative to individual specifications. It’s clear from Table 1 that the ensemble dominated in every category.

33/ A drawback is that the ensemble strategy produced many more trades than specifications with longer lookbacks. The ensemble also produced a larger proportion of short-term gains for tax purposes, resulting in an estimated 0.5% in excess tax costs vs the Original strategy.
34/ In the paper we proposed a statistically robust method to drastically reduce trading on short-term noise. This approach reduced trades by over 50 percent and almost completely neutralized the excess tax consequences of deploying the ensemble strategy.
35/ As a result, all of the original benefits of the ensemble were preserved after accounting for taxes.

32 / Conclusion:

33/ LOTS MORE analysis and details in the paper (39 pages) for those of you who have questions and/or want to dig deeper.
Also open for comments and/or questions here.
Download here:
investresolve.com/global-equity-…
Also open for comments and/or questions here.
Download here:
investresolve.com/global-equity-…
@threadreaderapp please unroll