,
10 tweets,
4 min read
Read on Twitter
Moody's: Baoshang Bank takeover negative for wholesale creditors (most critical).
S&P: "Our ratings factor strong support from the government for the banking industry and individual banks."
Fitch:"Impact that a small bank failure would have on market confidence is untested"
S&P: "Our ratings factor strong support from the government for the banking industry and individual banks."
Fitch:"Impact that a small bank failure would have on market confidence is untested"
So Moody's is the most sobering of the 3 rating agencies & both S&P and Fitch downplayed the impact. See comments above. 

Let's put it together:
a) Credit investors likely incurred losses on NCDs, financial bonds & subordinated debt by Baoshang;
b) Risk appetite to fund small banks lower, NCD issuance down (1 of the ways to fund
c) Funding costs (SHIBOR📈)
d) PBOC adds more injection (CNY250b)
a) Credit investors likely incurred losses on NCDs, financial bonds & subordinated debt by Baoshang;
b) Risk appetite to fund small banks lower, NCD issuance down (1 of the ways to fund
c) Funding costs (SHIBOR📈)
d) PBOC adds more injection (CNY250b)

Daily OMO injection today:
a) Well, to inject liquidity, so why? Well, to help ease funding conditions on this risk aversion & higher funding costs📈
b) Also 463bn of MLP expiring in June needing to refinancing
Wait a minute, but the PBOC wants a stable CNY. How to balance 🤔🤔
a) Well, to inject liquidity, so why? Well, to help ease funding conditions on this risk aversion & higher funding costs📈
b) Also 463bn of MLP expiring in June needing to refinancing
Wait a minute, but the PBOC wants a stable CNY. How to balance 🤔🤔
The reason why the PBOC injected a large OMO is b/c it needs to stabilize this risk aversion (well, if u're a credit investor in China, be vigilant).
Chart below shows u how Chinese banking system funds itself - still by good old deposits & very little via inter-bank.
Chart below shows u how Chinese banking system funds itself - still by good old deposits & very little via inter-bank.

Finally, let's not forget that Chinese banks' assets (the inverse of this on the other side of the balance sheet is DEBT) is 3 times GDP or 300% of GDP while the US is <100%.
But also note that it reflects the development of Chinese capital market as bond & equities shallower.
But also note that it reflects the development of Chinese capital market as bond & equities shallower.

Meaning, Chinese firms primarily BORROW from banks versus other ways to borrow like in the US where companies rely more on equities & bonds to borrow. Chart below shows size of banking system in China, which is 3Xs annual output
In many ways, u can say it looks more like Europe.
In many ways, u can say it looks more like Europe.

Here is a comparison of US banking system vs European. Very large in Europe versus the US as a share of GDP & like China reflects how firms in Europe fund themselves (through loans). Peak for Europe was 2012 at 3Xs GDP too (China now). So China got some deleveraging to catch up.
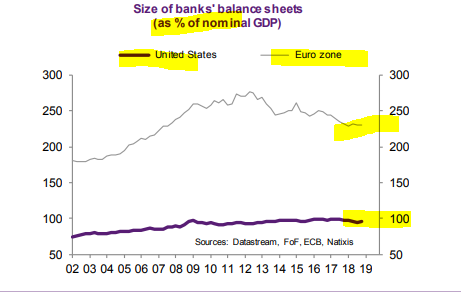
Below is a chart to show the difference in Europe vs the US in terms of loans to firms as a share of GDP. Meaning, risks to the US will likely come through a different channel than Europe & China.

Update: Investors w/ > CNY5bn or USD720m will get at least 70% of principal.
Those w/ 2-5bn will get at least 80% & those w/ 100-2bn will get at least 90% & anyone b/n CNY50-100m will get principal but no interest.
Most creditors have >CNY50m exposure & losses likely😬
Those w/ 2-5bn will get at least 80% & those w/ 100-2bn will get at least 90% & anyone b/n CNY50-100m will get principal but no interest.
Most creditors have >CNY50m exposure & losses likely😬