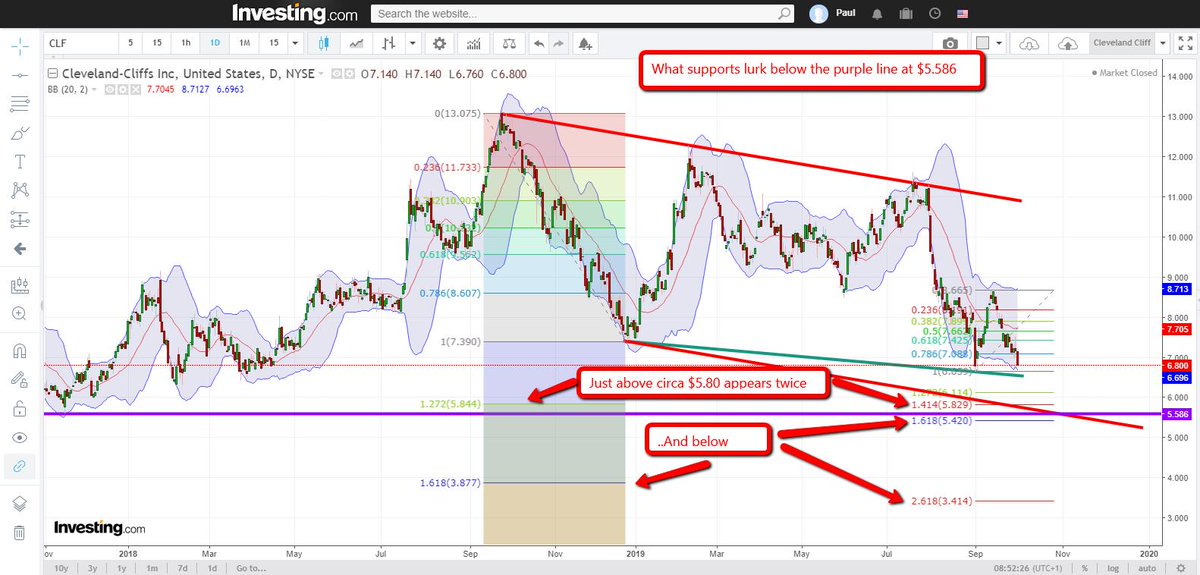
Case #3 Cleveland-Cliffs Inc (CLF)
Price keeps dropping lower but looking at the #BollingerBands it might slow down and we could see a rebound within the next two weeks.
2/8
Price keeps dropping lower but looking at the #BollingerBands it might slow down and we could see a rebound within the next two weeks.
2/8
Chart 1
Price compressed with the Bollinger Bands - the purple line is a very important low. A weekly close beneath will see prices fall further.
3/8
Price compressed with the Bollinger Bands - the purple line is a very important low. A weekly close beneath will see prices fall further.
3/8

Chart 2
Zoomed in. Bollinger Bands visible. Import resistance line drawn in red ... and then cloned, also in red - the clone is attempting to find support. #Fibs drawn from the last important swing high to low.
4/8
Zoomed in. Bollinger Bands visible. Import resistance line drawn in red ... and then cloned, also in red - the clone is attempting to find support. #Fibs drawn from the last important swing high to low.
4/8
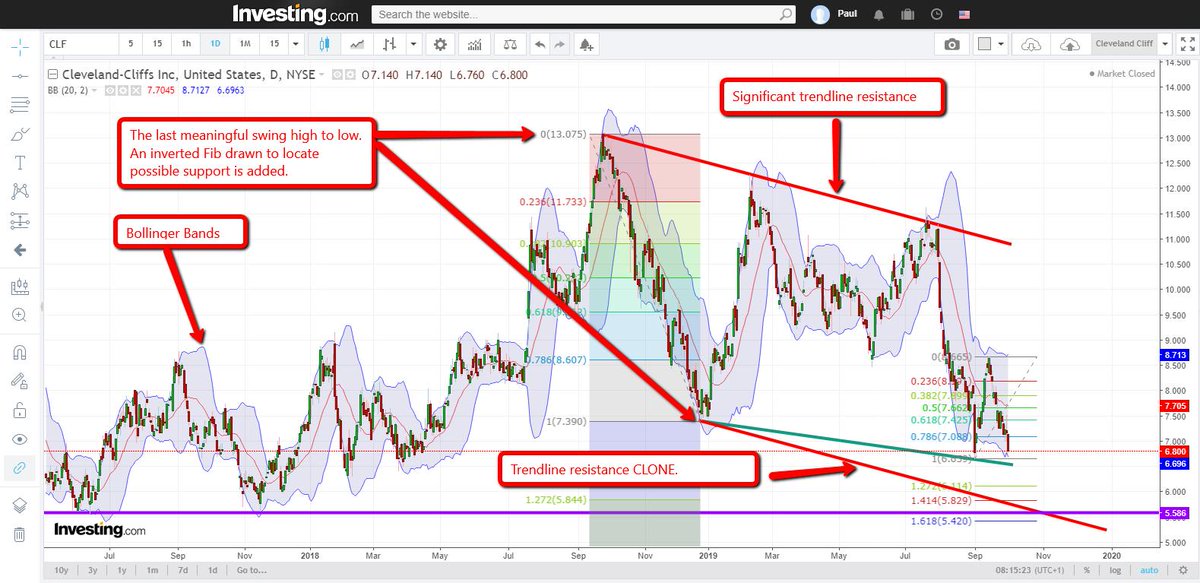
Chart 3
A #trendline is drawn off the lows - for now there are only 2 points connecting. We are looking for the 3rd low to connect: if it fails to hold on a daily close then the trendline will be deemed a trendline #pivot.
5/8
A #trendline is drawn off the lows - for now there are only 2 points connecting. We are looking for the 3rd low to connect: if it fails to hold on a daily close then the trendline will be deemed a trendline #pivot.
5/8
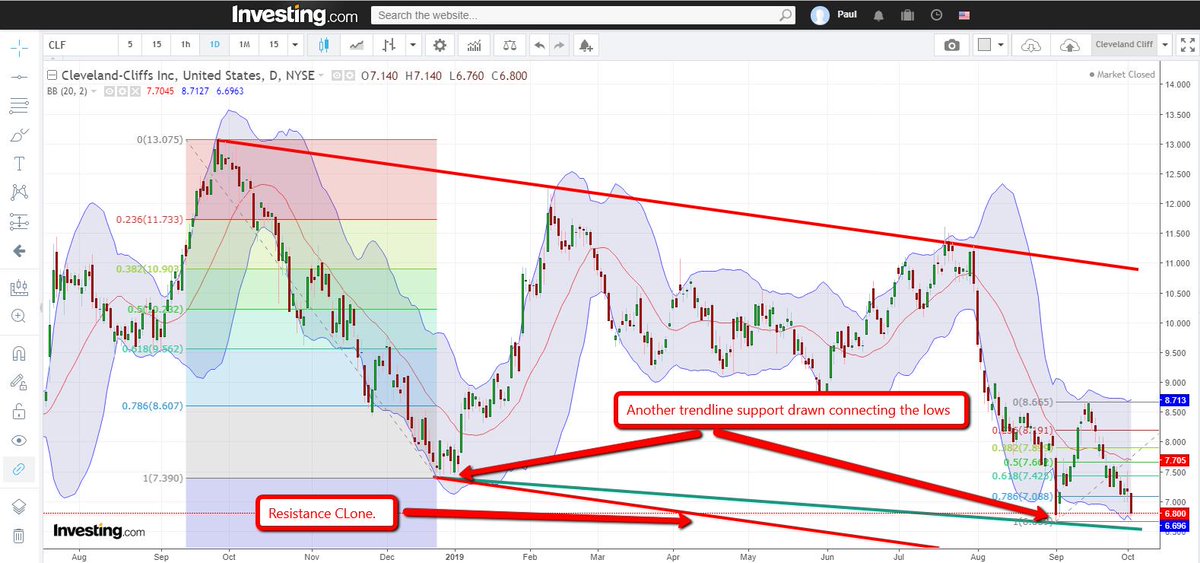
Chart 4
When price extends above/below the BB expect pullbacks.
6/8
When price extends above/below the BB expect pullbacks.
6/8

Chart 5
Looking for multiple confluence support points.
7/8
Looking for multiple confluence support points.
7/8

Chart 6
Prices need to hold if preferable on the possible trendline at circa $6.55 but most importantly the purple line. What happens if prices close below the purple line on a weekly basis - the next supports below.
8/8
Prices need to hold if preferable on the possible trendline at circa $6.55 but most importantly the purple line. What happens if prices close below the purple line on a weekly basis - the next supports below.
8/8