Gender in MP retirements
2017
67 women elected Cons MPs (21%)
249 men elected as Cons MPs
2019
20 Cons men not standing (8% of M)
Average age: 64
Average years as MP: 20
9 Cons women not standing (13% of F)
Average age of female retirees: 51
Average years as MP: 10 years
2017
67 women elected Cons MPs (21%)
249 men elected as Cons MPs
2019
20 Cons men not standing (8% of M)
Average age: 64
Average years as MP: 20
9 Cons women not standing (13% of F)
Average age of female retirees: 51
Average years as MP: 10 years
The Labour retirement pattern differs
119 women elected (45%) in 2017
143 men elected in 2017
Announcements to date (not final)
8 women not standing (6% of Lab women)
14 men not standing (10% of Lab men)
119 women elected (45%) in 2017
143 men elected in 2017
Announcements to date (not final)
8 women not standing (6% of Lab women)
14 men not standing (10% of Lab men)
Cons pattern mixes politics and gender
Several "class of 2010" men leave parliament (Boles, Jo J, Harrington, Lefroy, Rory S). Bill Grant (2017 intake), because he is 68.
5 of 9 Cons women retirees aged 50 or under, 8/9 under 60.
Only 2/20 men (Jo Johnson, Rory Stewart) < 50
Several "class of 2010" men leave parliament (Boles, Jo J, Harrington, Lefroy, Rory S). Bill Grant (2017 intake), because he is 68.
5 of 9 Cons women retirees aged 50 or under, 8/9 under 60.
Only 2/20 men (Jo Johnson, Rory Stewart) < 50
Not all announcements have been made yet, so those are initial stats-in-progress.
Hope other number-crunchers could look at gender, age and politics on the final numbers. (A bigger job but v.interesting to go back to the whole 2010 cohorts on defeat, retirement, min office etc)
Hope other number-crunchers could look at gender, age and politics on the final numbers. (A bigger job but v.interesting to go back to the whole 2010 cohorts on defeat, retirement, min office etc)
A key issue that @Women2Win @fawcettsociety and many others that have promoted gender equality & voice in politics will want to scrutinise during and beyond this campaign
My stats are using "elected for the party in 2017" as the Conservative and Labour cohort, so those who leave a party then stand down (then get whip back/don't ) are all included, if not running again in the GE for the Cons or anybody else
Cons women (in 2017) not standing
Caroline Spelman (61), 22 years (1997)
Sarah Newton (58), 9 years (2010)
Amber Rudd (56), 9
Claire Perry (55), 9
Justine Greening (50), 14 (2005)
Nicky Morgan (47), 9
Seema Kennedy (45), 4 yrs (2015)
Mims Davies (44), 4
Heidi Allen (44), 9
Caroline Spelman (61), 22 years (1997)
Sarah Newton (58), 9 years (2010)
Amber Rudd (56), 9
Claire Perry (55), 9
Justine Greening (50), 14 (2005)
Nicky Morgan (47), 9
Seema Kennedy (45), 4 yrs (2015)
Mims Davies (44), 4
Heidi Allen (44), 9
Labour women not standing
Average age: 67
Average years as MP: 20.5
Ann Clwyd, 82, 35 years as MP
Kate Hoey, 73, 30 years
Louise Ellman, 73, 22
Roberta Blackman-Woods, 62, 14
Helen Jones, 64, 22
Gloria de Piero, 46, 9 years
Anne Coffey, 73, 27 years
Joan Ryan, 64, 17
Average age: 67
Average years as MP: 20.5
Ann Clwyd, 82, 35 years as MP
Kate Hoey, 73, 30 years
Louise Ellman, 73, 22
Roberta Blackman-Woods, 62, 14
Helen Jones, 64, 22
Gloria de Piero, 46, 9 years
Anne Coffey, 73, 27 years
Joan Ryan, 64, 17
The Labour female retirements have rather more in common with the Conservative male retirements (on age and service) than the Conservative female retirements do.
Contrast is specifically Cons women
Labour men, retiring
Average age: 65
Average years as MP: 23
Labour women retiring
Average age: 67
Ave years as MP: 21
Cons men retiring
Average age: 64
Ave years as MP: 20
Cons women retiring
Average age: 51
Ave years as MP: 10
Labour men, retiring
Average age: 65
Average years as MP: 23
Labour women retiring
Average age: 67
Ave years as MP: 21
Cons men retiring
Average age: 64
Ave years as MP: 20
Cons women retiring
Average age: 51
Ave years as MP: 10
Owen Smith (49), and Gloria de Piero (46), both class of 2010 are the only retirees aged under 50, among 13 Labour men and 9 Labour women. There are 2 Cons men under 50 (Jo Johnson, Rory Stewart) of 20
But a majority of Conservative women (5 of 9) retirees are under 50.
But a majority of Conservative women (5 of 9) retirees are under 50.
LibDem men (2/10: Cable, Lamb)
Average age: 69
Average years: 19
I think only LibDem female MP announced as not running is Heidi Allen (who is in my elected as Cons 2017 cohort)
Average age: 69
Average years: 19
I think only LibDem female MP announced as not running is Heidi Allen (who is in my elected as Cons 2017 cohort)
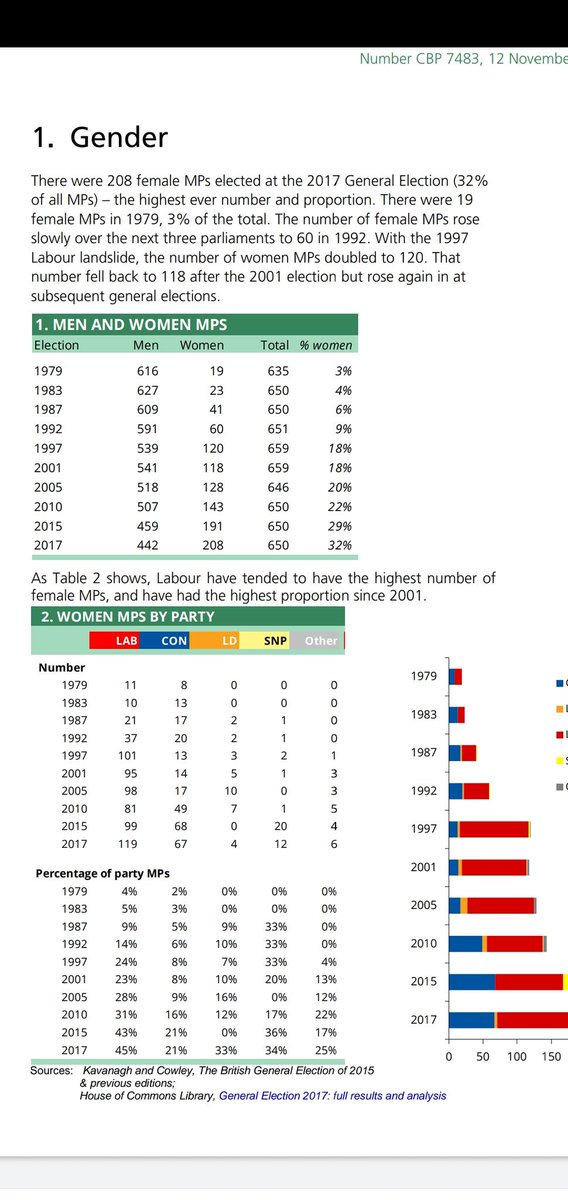
The "par" % score for female retirements should be below the % of women in the House, rather than equal to it. Only 4/25 longest serving MPs (7+ terms) are women. A larger proportion of women are post-2010 (< 3 terms) 


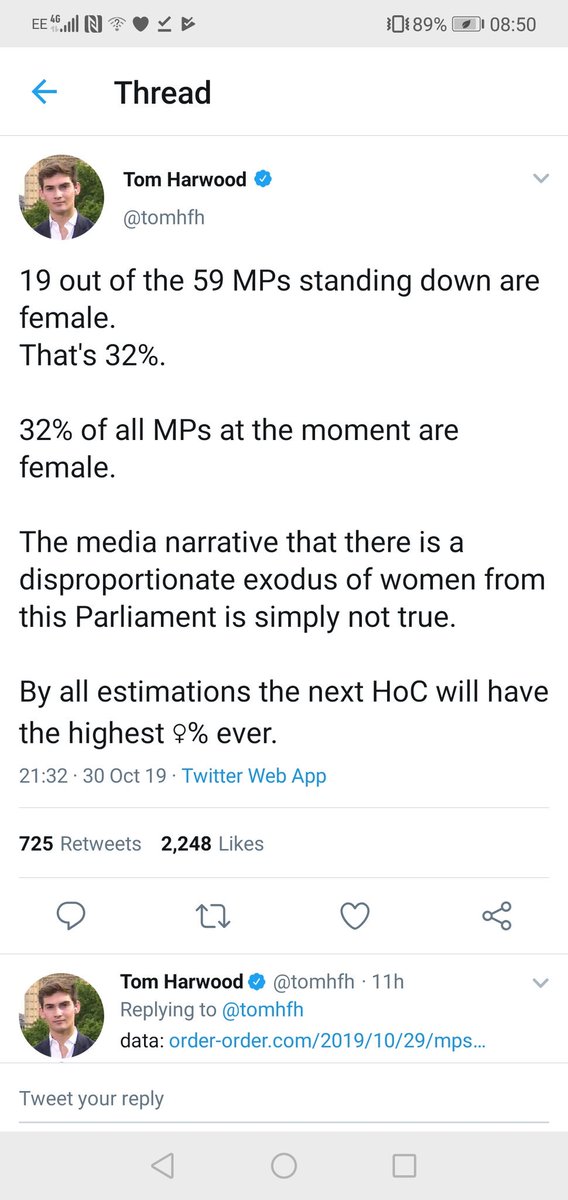
Typically, retiring cohorts reflect intakes from 4-6 elections ago. (Eg median retiree "class of 1997"/22 years). So takes like @tomfh miss the point. First time that retiring cohort is as female as House overall. Partly, organic impact (1992-97 intake)+"premature" C2010 retirees
Could illuminate (Nuffield Election studies have retiree data) if compared post-1997
* intake cohorts
* retirement cohorts
* Overall Commons
I suspect this is first time %women retiring matches Commons%. Pattern of intakes doesnt fit "that's what we'd expect" hypothesis
* intake cohorts
* retirement cohorts
* Overall Commons
I suspect this is first time %women retiring matches Commons%. Pattern of intakes doesnt fit "that's what we'd expect" hypothesis

This data can't resolve how much Commons culture, party culture, online abuse, post-Cameron shifts, Brexit, other factors contribute.
I think does suggest the + Cons shift towards gender equity, catalysed by 2010 intakes, not yet as entrenched as Labour shifts, post-1997/2010
I think does suggest the + Cons shift towards gender equity, catalysed by 2010 intakes, not yet as entrenched as Labour shifts, post-1997/2010
I suggest v.rough "par" expectation for 2019 retirements (if gender not a factor at all in length of service) in ballpark of
18% women
24% of Labour retirements
8% Cons retirements
(That just uses Parliamentary party profiles of 1997 as rough rule of thumb for 2019 retirements)
18% women
24% of Labour retirements
8% Cons retirements
(That just uses Parliamentary party profiles of 1997 as rough rule of thumb for 2019 retirements)
Certainly par "expectations" score should not be higher than overall 2010 profile: 22% women, 16% of C retirements, 31% of Lab retirements
Its just an obvious mistake to use overall gender balance of 2019 House of Commons as a guide to "expected" gender % of 2019 retirements
Its just an obvious mistake to use overall gender balance of 2019 House of Commons as a guide to "expected" gender % of 2019 retirements