I sometimes get asked (usually by @sdonnan) why I usually focus on the goods trade data, and why I don't give the services data comparable attention.
Well, consider the services trade data from the euro area, not a small part of the global economy ...
1/x
Well, consider the services trade data from the euro area, not a small part of the global economy ...
1/x
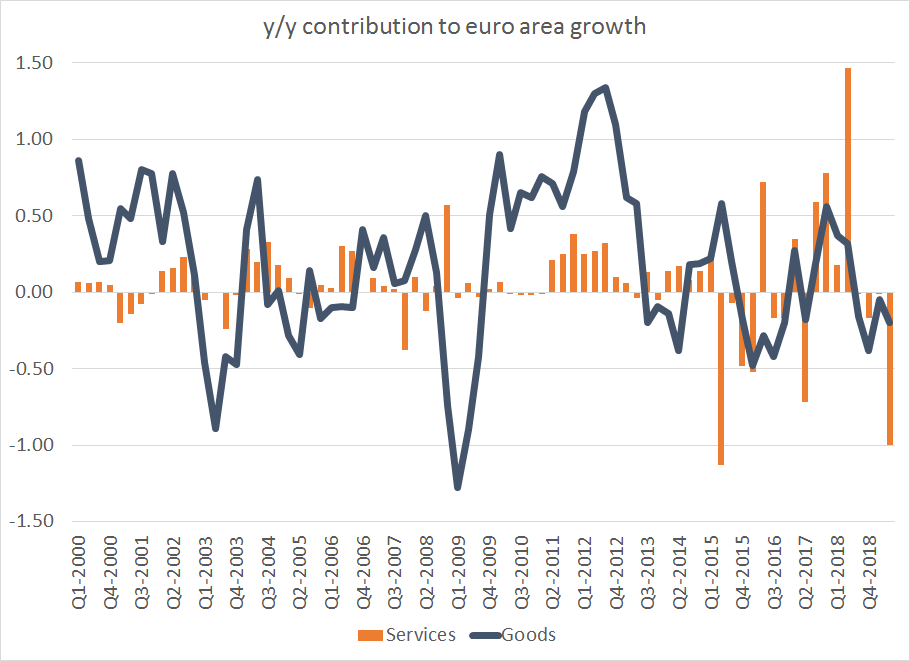
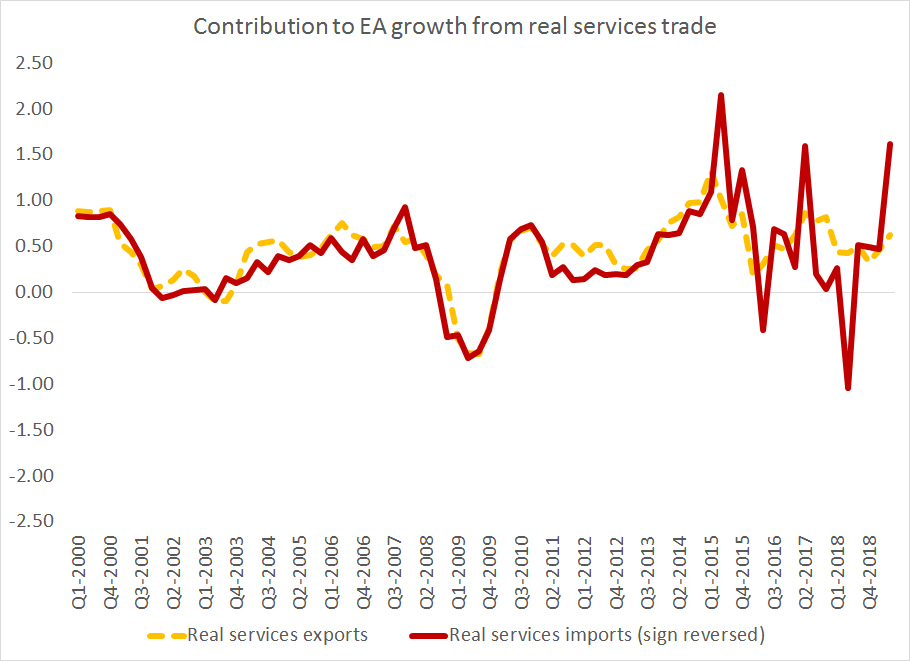
@sdonnan Services subtracted 1 pp from EA growth in q2 -- not a small sum. The question is "is that real?"
2/x
2/x
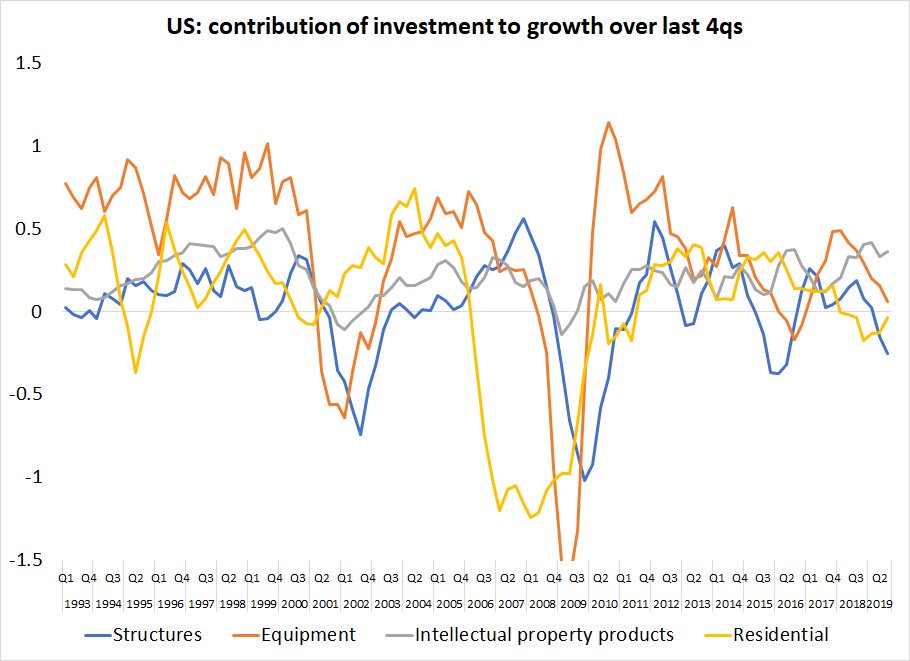
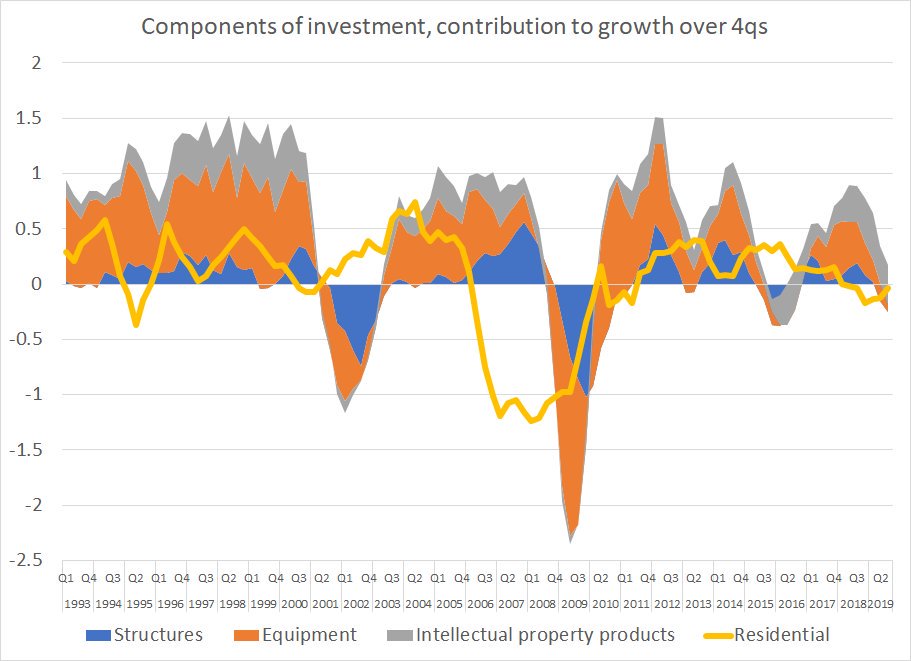
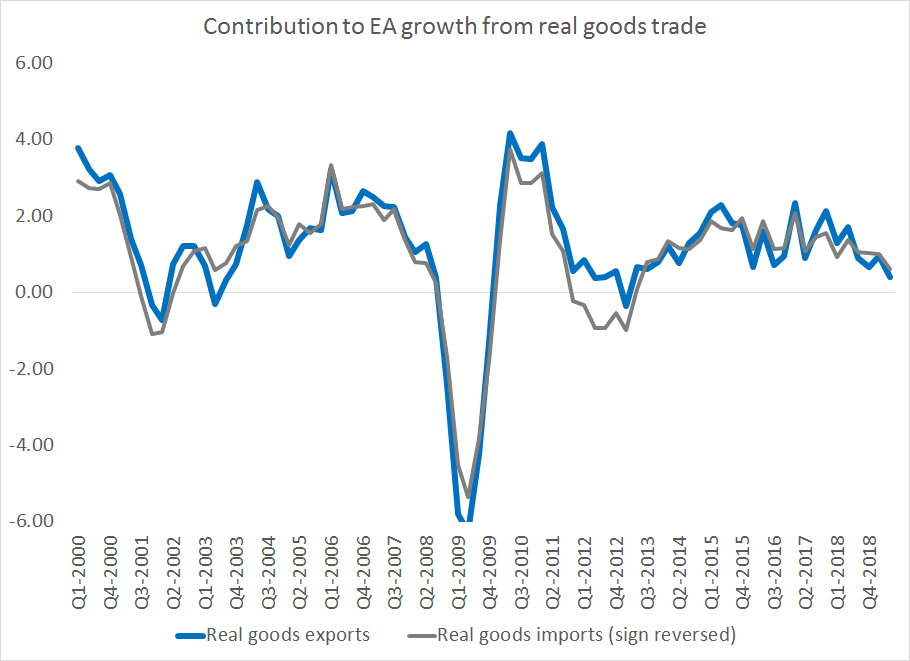
@sdonnan The disaggregated goods data basically makes sense -- exports are slowing with the global economy.
and the EA is an open economy, so goods trade ends up mattering more than it typically does for the US
3/x
and the EA is an open economy, so goods trade ends up mattering more than it typically does for the US
3/x
@sdonnan What of the services data?
Well, there are three quarters when service imports jump and subtract over 1.5 pp (y/y, as a contribution, with sign reversed so a rise in imports is up in the chart) from EA growth.
4/x
Well, there are three quarters when service imports jump and subtract over 1.5 pp (y/y, as a contribution, with sign reversed so a rise in imports is up in the chart) from EA growth.
4/x
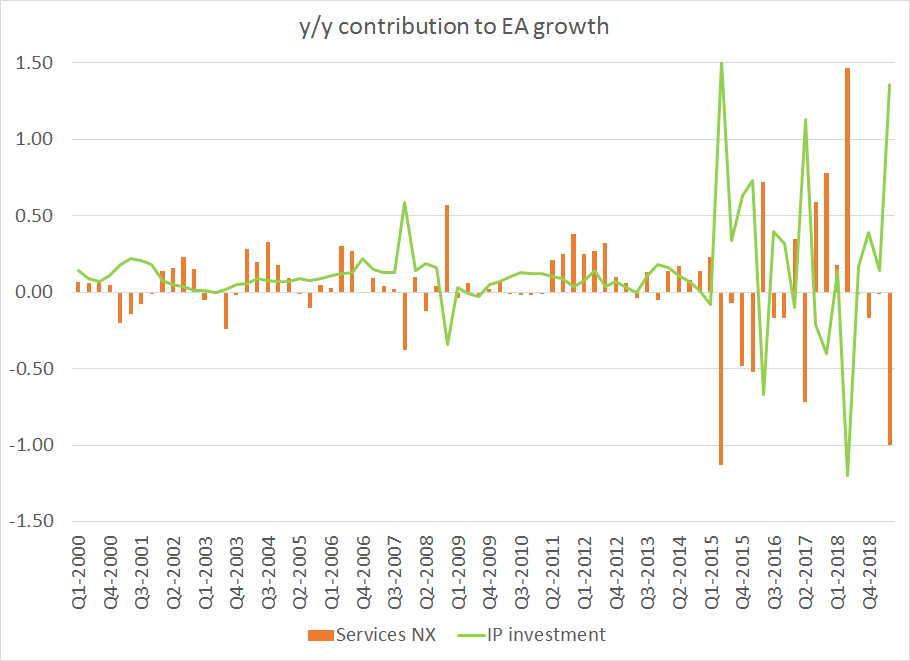
@sdonnan What is driving the extreme swings in the contribution from services imports?
swings in IP investment.
(the first swing is from the Netherlands, the next two are from Ireland)
5/x
swings in IP investment.
(the first swing is from the Netherlands, the next two are from Ireland)
5/x
@sdonnan What's likely happening?
In all probability, one subsidiary of a US MNC is buying the IP rights of another subsidiary of a US MNC for tax reasons ...
If the second sub is outside the EA, that registers as a big investment in imported (IP) services ...
6/x
In all probability, one subsidiary of a US MNC is buying the IP rights of another subsidiary of a US MNC for tax reasons ...
If the second sub is outside the EA, that registers as a big investment in imported (IP) services ...
6/x
@sdonnan all this matters of course (it is evidence of scale of tax related distortions, among other things), but it doesn't provide as much data about the "real" economy as the goods data ...
7/7
7/7