As promised, here is my final VA state legislative analysis thread: As I've said, the fundamentals all point to an climate that favors Ds, including my negative partisanship turnout theory, which suggests that Ds should enjoy a turnout adv in this low turnout cycle. People
pointing to the Ds under performance in 2015 relative to their polls should understand that Ds did not have the "Trump Effect" pushing up their turnout back then; they were happy & complacent & failing to flex their growing demographic muscles in VA causing Rs to over perform.
relative their share of the electorate. No doubt, Rs also benefited from an environment where pure Is were breaking in their favor. Those days are gone for now, and the VA GOP is dealing w a massive down-ticket brand drag from Trump which we can see clearly in our survey data. 

The Trump Effect has combined to create measurable and durable advantages for Ds on the generic ballot & the "control of the Assembly" questions on all of our surveys since Spring 2019, and under even my most stringent likely voter modeling.


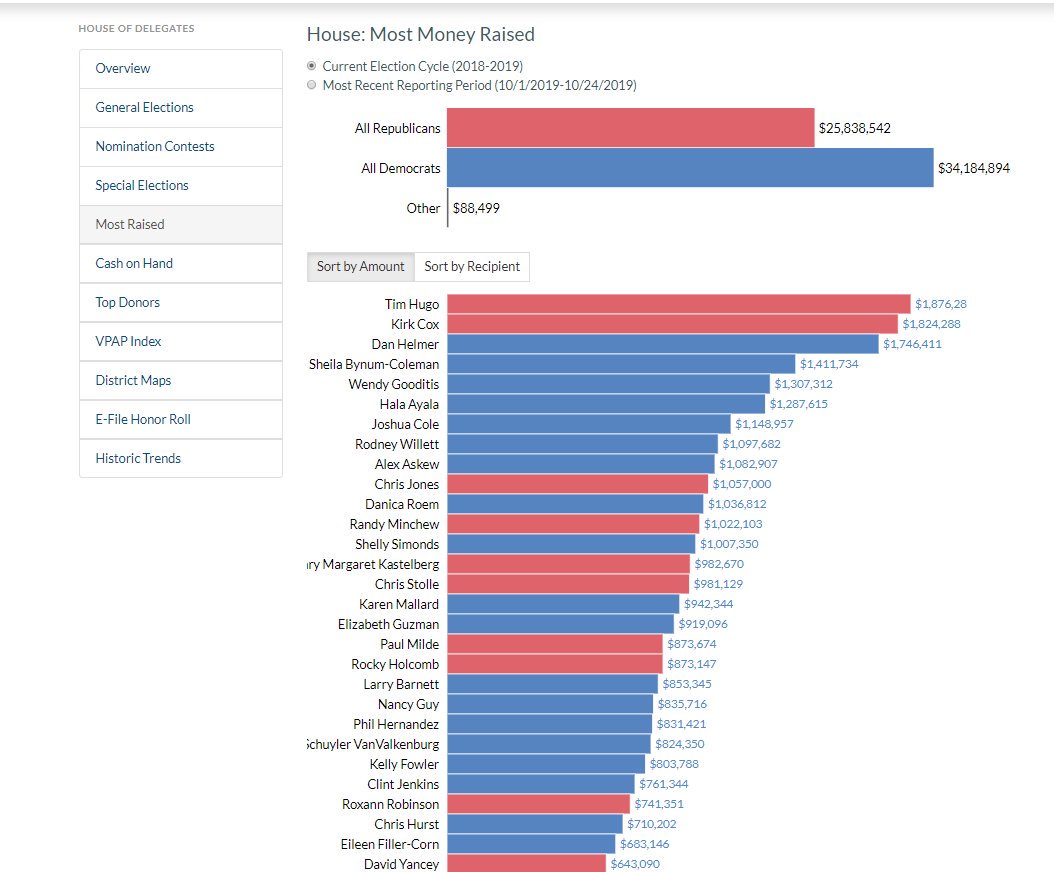
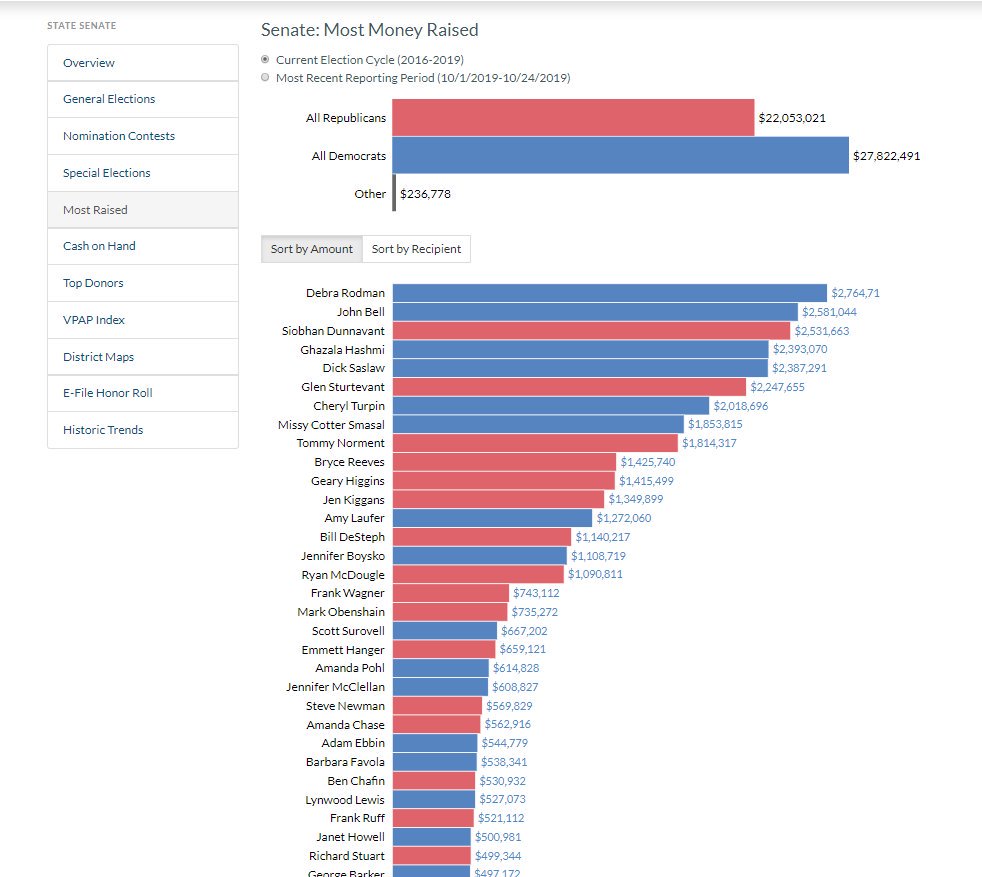
The data suggests Ds have an adv. they lacked in the '15 cycle. Similar to the 2017 & 2018 cycles, which produced "Blue Waves" Ds recruited a wide field of candidates, outraised Rs, & we see historic levels of voter registration & absentee ballot data (data from @vpapupdates

As you'll recall, I put out an analysis in Sept that bent some elements of my forecasting model to these state legislative races, and identified those districts currently held by the GOP that are most vulnerable to Dem turnout surges. cnu.edu/wasoncenter/20…
This identified 5 districts that Dems gained in the 2017 wave that had modest R + PVI scores. As you can see, there is a strong relationship between the PVI score and the margin by which Ds carried the district in 2017.

I then listed these, as well as the 12 House of Delegate seats currently held by the GOP that fall within competitive PVI scores and 6 state senate districts that are similarly situated, 3 of which are very competitive (1 is a flipper). The number of seats in the H.O.D. ⬆️due


to a court-order redistricting that implemented new maps in order to alleviate a racial gerrymander. The area of the state that was affected was primarily the Hampton Roads area. Some districts, such as GOP Speaker of the H.O.D. (66th) Kirk Cox, were dramatically impacted,
moving from an R+14 to an R+1.6- making it one of the most attractive pick up opportunities for Ds in the state. The Democrats need to net 2 seats in the H.O.D. to take control of that chamber, and have several pathways to get there, assuming they can hold onto their 2017 gains.
In the state senate- Ds also need two seats, and unlike the H.O.D., the state senate has not faced the post-Trump VA electorate. Still, the PVI scores give us a good sense of the partisan elasticity of each of the competitive senate races bc they are calculated based in part on
district's 2017 performance. So, what will happen? Again, the data all points to a strong turnout that favors Democrats. It needs to be such as an electorate that resembles the 2015 electorate would produce a good night for Virginia Republicans. We lack 2015 exit data for these
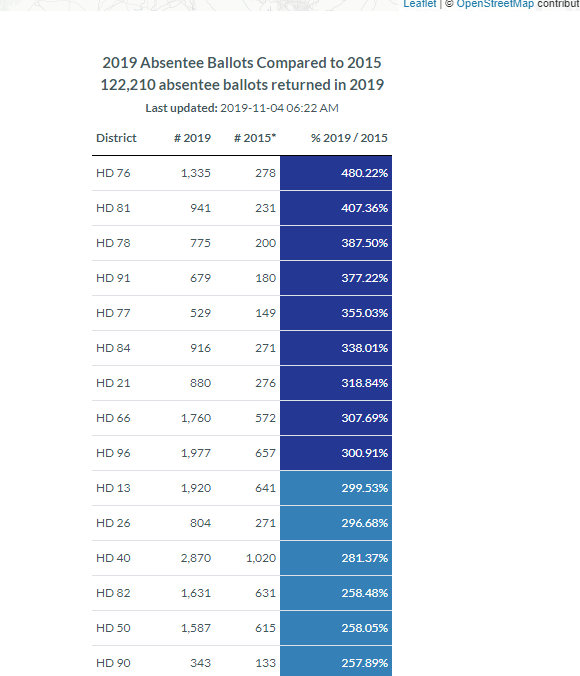
races, but suffice it to say, in order for Dems to hold onto their 2017 gains, & make additional seat gains, the electorate need to be younger & more diverse than in 2015. One good sign for Ds is that absentee balloting is up sharply everywhere, its above 300% its 2015 levels in
some districts, and at 200% or more in virtually all the competitive races. We also know there has been a lot of variability in the way D candidates have campaigned, w some candidates, like Dan Helmer in HD 40 & John Bell in Senate 13 nationalizing their races & attempting

to boost turnout via bringing in 2020 Dem pres candidates & sending mailers tying their opponents to Trump and other candidates like Shelly Simonds and Martha Mugler in Hampton Roads running traditional Dem campaigns emphasizing Medicaid and staying away from hot button issues.
The other variable of significance in my forecasting work is the % of college educated voters in a district. Tim Hugo's district (HD 40) is highly educated which is more than 25pts more educated than Yancey's district (the 94th). Anyone that follows me knows that college edu

is one of the most important factors in predicting whether or not someone votes- esp in elections like this. This is why I think we may see uneven turnout across the Commonwealth, and possibly, uneven seat gains. If the Ds have an Achilles heel, its that the epicenter of any 2019
wave must roll through more hostile territory than NOVA in terms of educ levels, than the 2017 wave. That said, the data suggests SOME level of a turnout surge for Ds. We know based on contests such as the NC-9 special, which has similar demos to several GOP-held HOD districts,


a natural turnout surge can be fairly large. In the case of NC-9, it fell short of flipping an R+6 district by a couple of points, yes, but it still was quite large. This suggests that Ds could be good for an R+2 or R+3 level surge so long as a modest D turnout surge manifests.
Under that scenario, they'd hold their 2017 gains & potentially pick up as many as 10 House seats: HDs 27, 28, 40, 66, 83, 84, 85, 91, 94, 100. BUT (see how that is literally a big but?) its imp to note, this requires sign. improvement of AA TO over historic TO for this cycle
But, its unclear how much these campaigns have invested in AA turnout. Some of this need could be offset by an expected surge in Indie voter turnout over previous off-off year cycles (like we saw in 2018). Both of these key constituencies are instrumental Dem coalition voters
& they MUST have good turnout for Ds to hold onto, let alone expand on, their current seat share. The 4 state senate districts within the R+3 or below zone are SDs 7, 10, 12, and 13 & the 10th is primed to flip bc its actually D+4. This is why the 10th almost flipped in '15
despite the lack of a Dem enthusiasm adv. Its just a guess, but I *feel* like the natural D turnout boost *might* be large enough to overcome R+2 or even 3 territory & in places where D candidates nationalized their strategy & focused specifically on turnout, perhaps even larger.
Of course, I could be wrong and D turnout could simply explode across the board and everything R+5 or even +6 could flip. Or, it could be that Ds fail to motivate voters outside the highly educated NOVA districts + a couple of the most favorable HR districts. Given the data we've
seen, its hard to imagine a scenario where Ds fall short on winning control- but its certainly not outside what I call the Silver probability band. I think we have potential to see 35% turnout. The post Motor Voter high, set in 1999 is 36%. Let's beat that VA! I'd love to see 40!