Good morning! #Equities continue to defy gravity. This has more to do with the insane monetary environment CBs have created. Macro economic reality says something completely different. The division (=the bubble) will come to haunt us all. Please stay tuned for #HZupdates
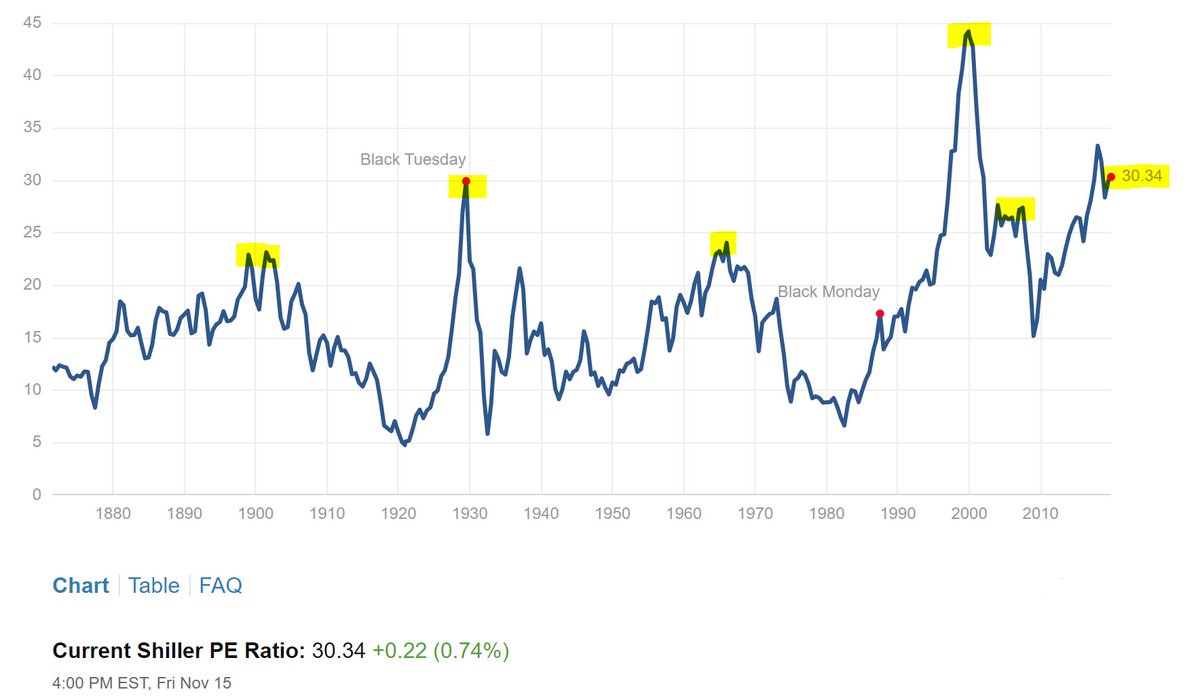
Why is it, that some analysts try to explain away the obvious? We have a major bubble in ...well almost all assets. #Schiller PE for #SP500 tells us, that the bubble is at 1929-level. Could it grow bigger? Sure!! But that does not make it a non-bubble #HZupdates 
Amount of neg. yielding debt has skyrocketed. Remember, this is discount factor. If discount factor is closing in on 0 (or goes neg.) then value of any asset is going to infinity. But that has NOTHING to do with true value of any asset. This is "Bubble food"! #HZupdates

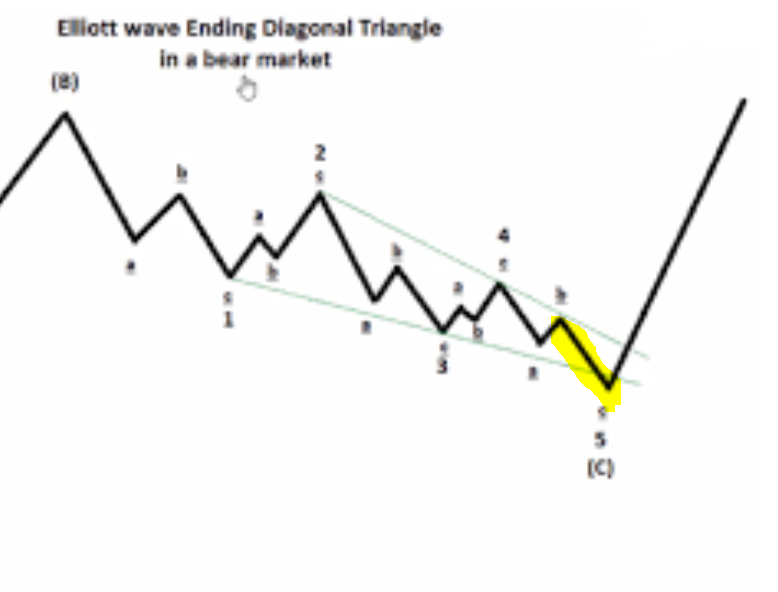
How long will the insanity (because that is, what it is!) carry on? Well - we could pot. see #SP500 rally on to ~3224 or even ~3466. A True Blow-off top - or a Throw-over of the Ending Expanding Diagonal. But - it does not make it a non-bubble. Only a really ugly one! #HZupdates

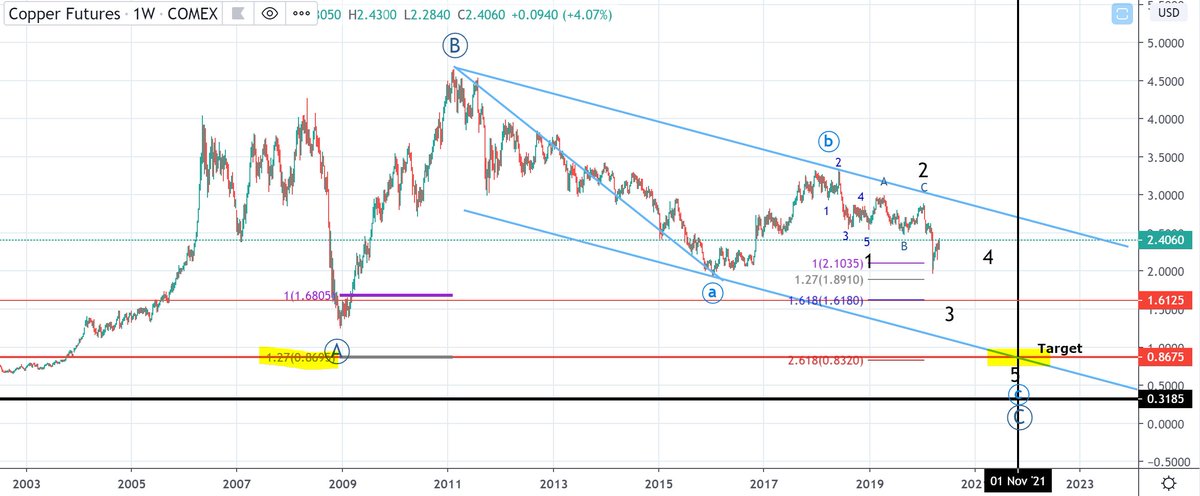
Macro economic reality is quite different. #Copper tells the full picture. Until 2008, we had inflationary environment. Wave A (2008-09) was sharp deflationary drop. A Bounce (B) followed, before long wave C started to unfold. Still we are to see final wave 5 #HZupdates

This picture tells us, that we will not see inflation from here on. Zooming in on #Copper, we see how it currently settles below trendline (wave 4 bounce). We could see yet another rally, but the outlook is bearish and crash likely. LT-bottom will likely <2008-level #HZupdates

You have analysts telling us #Stagflation is right ahead. Well, you will not have stagflation unless #Oil and #Commodities are about to take off while economy sinks (as Copper predicts). So, next step is to investigate chart of Oil and Commodities. Bullish or Bearish? #HZupdates
#Oil chart has not changed. Still seeing Ending Diagonal, which requires another drop to triangle bottom. LT-target <20. A drop in #Oil is not coincident with #Stagflation. Hence, we are more likely to see a #Deflationary drop before full structure has been played out #HZupdates
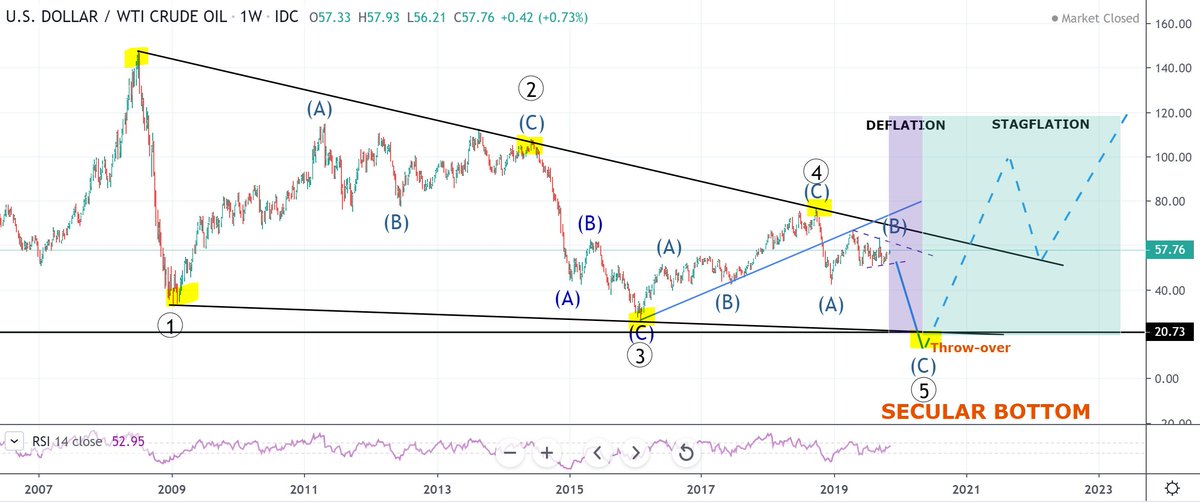
However, analysts calling for #Stagflation will eventually be right. This is where we end. However, the deflationary drop is most likely what will come first. But as main driver of deflation MUST be related to #equities, we must likely wait for top here before Deflation unfolds
And with buyers like Swiss National Bank.... what could possible go wrong? Think about it... a CB printing money and buying #equities for the new fresh money! Sure it is all real value, when share price goes up?? No! This is the ultimate CB-bubble #HZupdates

In fact, we can understand why Swiss National bank does this. Why buy neg. yielding bonds? And if you are to loose money on your equity positions - well then you print more money, which only helps weaken the currency (Currency war) and hence stimulate exports...They cannot loose!
The one that looses in this Endgame is the average worker. When deflation finally catches up, he will loose his job as economy sinks. And as CBs push economy into stagflation through new crazy interventions, he will loose further, as purchasing power is eroded during stagflation
This is environment where revolutions are born which topples regimes... I expect #YellowVests movements to spread to many countries around the world before the entire cycle has come to and end. This unfortunately is breading ground for scary political perspectives and nationalism
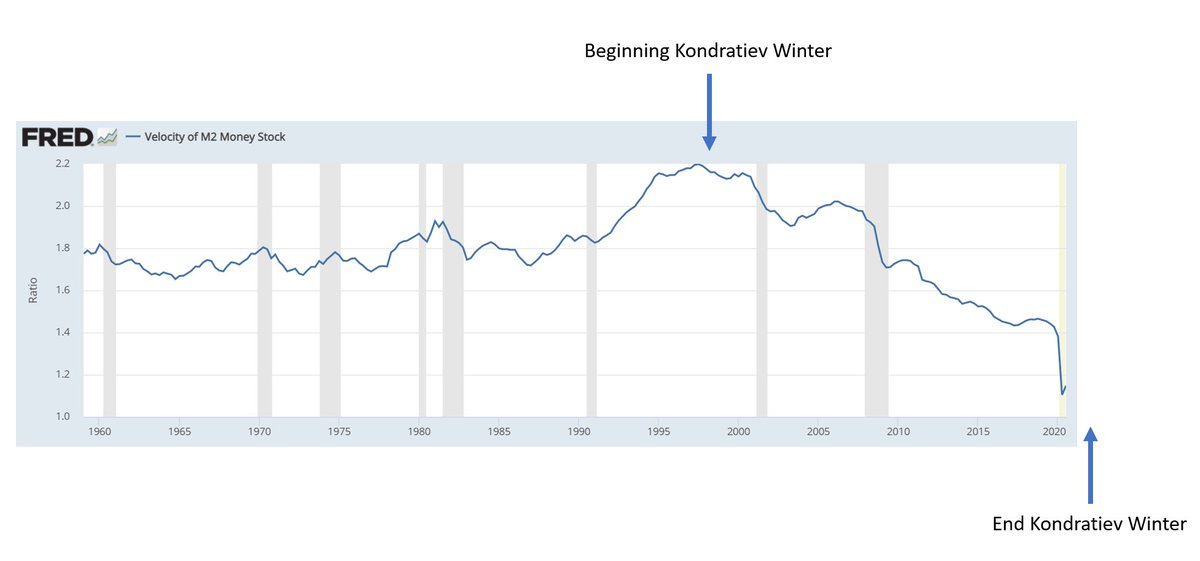
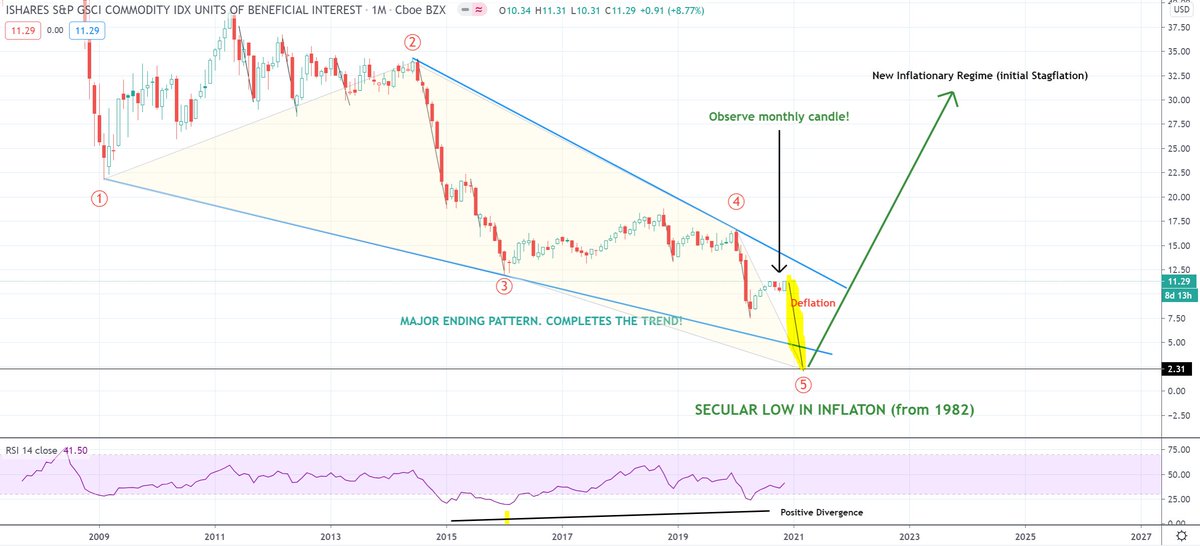
#CRB gives us same outlook. Lower in deflationary bust - before SECULAR BOTTOM and much higher levels = higher prices on ordinary goods. Bottom is where the "inflation genie" escapes the bottle. That is not now! #HZupdates

CBs seems to think, that they can avoid deflationary bust, if only they print hard enough. This is not how I see it! Structure will play out! The only effect of CBs printing will be, that they build larger bubble which only leads to bigger crash and longer stagflation period
This belief, by CBs, that they can change deflationary/inflationary regime and think they can micro-manage inflation level is absurd and naive. This is the major hubris, for which we will all pay. This is MAIN reason why we have the greatest bubble ever at our hands #HZupdates
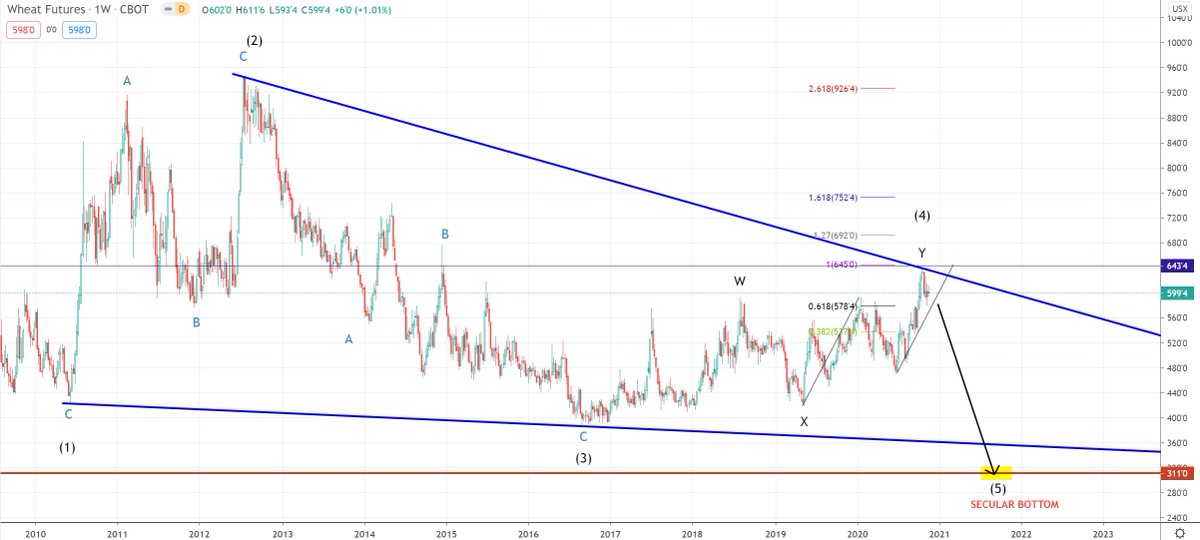
So - clearly the only alternative will be #Gold #Silver! YES - it is! But TIMING IS EVERYTHING! And in fact, the coming period of stagflation is a time, where all #commodities will do well. When secular bottom is in for commodities, we will see much higher levels. Here #wheat

So if #Commodities, #Oil, #Copper (and #AUDUSD), etc. will see new lows why then do analysts believe in #Gold Bull from here? Because of Financial Apocalypse ahead. Well yes - but you cannot buy bread with Gold. In fact, you will probably need to sell gold to get USD to buy bread

And with LT Gold chart looking like this - I tell you we have an ugly Gold Bear market ahead - BEFORE Gold rallies to new highs. Remember, I'm the greatest Gold Bull LT of all :) Bottom ~800-890 #HZupdates

So if we pull the charts together.... #Copper down (economy sinks) while #Commodities (bottom sooner than Copper) - and #Gold Bear market... This is the outlook of a Deflationary Bust - a panicking FED - and a long Stagflation period (where Gold explodes higher) #HZupdates
But - back to my initial question.... WHEN?? Well - perhaps at #SP500 ~3234 or 3466. We must continue to look for indications in #Copper, #AUDUSD, etc. Not yet time to be short. Time to be long? I don't know! Perhaps the time to stay in cash? Sometimes 0% return is OK! #HZupdates

That is it for today! We truly live in extraordinary times. I hope the public some day will realize CBs role in this pot. calamity in markets and economy! For now - stay safe! Have a great weekend all! #HZupdates
@threadreaderapp Please unroll :)
• • •
Missing some Tweet in this thread? You can try to
force a refresh