
1/
Hey folks: I wanted to share something @apmresearch just released that I’m very proud of:
Our VOTER PROFILE TOOLS, as part of our broader #RepresentingUS project. (Read: A wealth of data to understand the US electorate in interactive @tableau tools.)
apmresearchlab.org/representingus…
Hey folks: I wanted to share something @apmresearch just released that I’m very proud of:
Our VOTER PROFILE TOOLS, as part of our broader #RepresentingUS project. (Read: A wealth of data to understand the US electorate in interactive @tableau tools.)
apmresearchlab.org/representingus…
@APMResearch @tableau 2/
We at @apmresearch released these tools on #IowaCaucus day, but expect that they will be valuable up until the #2020election & beyond—to understand how eligible voters differ—often dramatically—from state to state & in each congressional district.
apmresearchlab.org/representingus…
We at @apmresearch released these tools on #IowaCaucus day, but expect that they will be valuable up until the #2020election & beyond—to understand how eligible voters differ—often dramatically—from state to state & in each congressional district.
apmresearchlab.org/representingus…
@APMResearch @tableau 3/
Already I’ve read numerous #media stories about the #IowaCaucuses & #NewHampshirePrimary saying those states don’t reflect the nation’s #demographics, but the #journalists didn’t include any data as to HOW they differed and to what degree.
Already I’ve read numerous #media stories about the #IowaCaucuses & #NewHampshirePrimary saying those states don’t reflect the nation’s #demographics, but the #journalists didn’t include any data as to HOW they differed and to what degree.
@APMResearch @tableau 4/
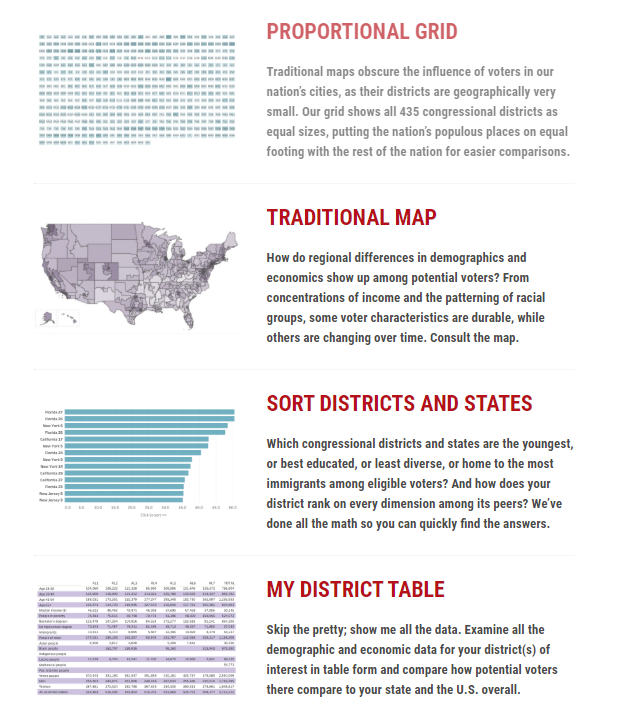
The @apmresearch VOTER PROFILE TOOLS have:
🎂 Voters by age: from youngest 🌱 to more seasoned 🧂
👋🏿👋🏽👋🏻 Voters by race
🎓 Bachelor’s degree+
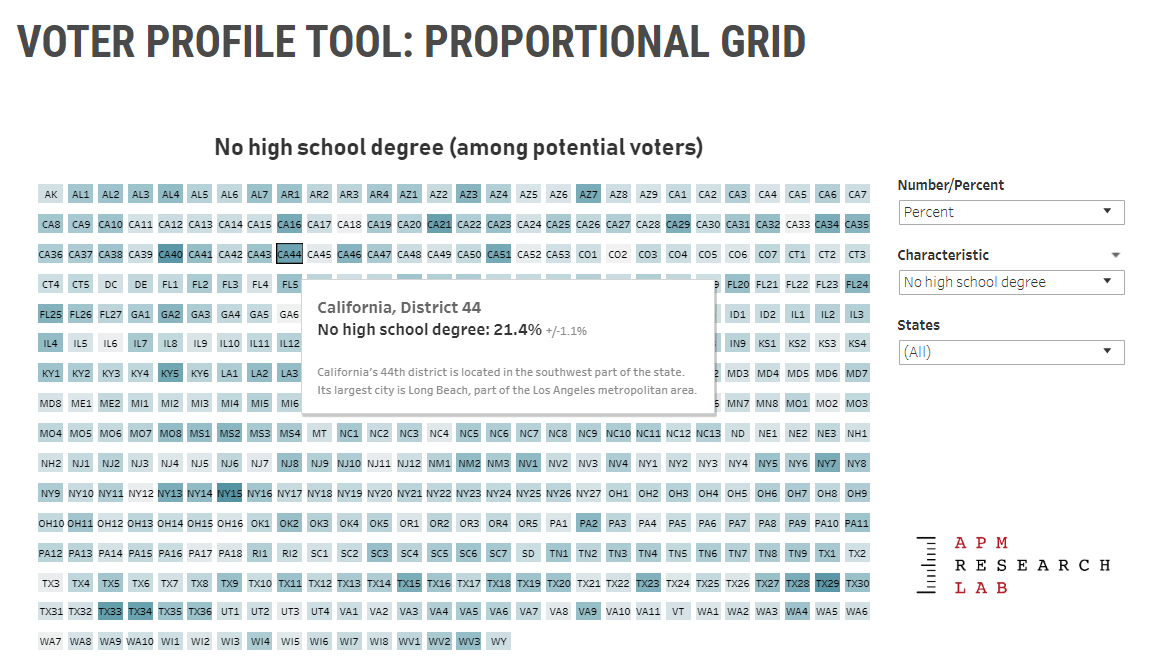
🎓 No high school diploma
💵 Median income & poverty
🚹🚺 Men & women (sorry, no non-binary data exists)
& 🌍 Immigrants (naturalized)
The @apmresearch VOTER PROFILE TOOLS have:
🎂 Voters by age: from youngest 🌱 to more seasoned 🧂
👋🏿👋🏽👋🏻 Voters by race
🎓 Bachelor’s degree+
🎓 No high school diploma
💵 Median income & poverty
🚹🚺 Men & women (sorry, no non-binary data exists)
& 🌍 Immigrants (naturalized)
@APMResearch @tableau 5/
We at @apmresearch think they are essential tools for reading the political tea leaves, for understanding how voters’ backgrounds & perspectives change as you move around the country.
apmresearchlab.org/representingus…
#NewHampshirePrimary #NewHampshire #Election2020
We at @apmresearch think they are essential tools for reading the political tea leaves, for understanding how voters’ backgrounds & perspectives change as you move around the country.
apmresearchlab.org/representingus…
#NewHampshirePrimary #NewHampshire #Election2020
@APMResearch @tableau 6/
The @apmresearch VOTER PROFILE TOOLS are designed in @tableau, published in @tableaupublic. There are more than 222,000 data points “under the hood” that power the #dataviz. They showcase the latest #ACSdata from the @uscensusbureau.
apmresearchlab.org/representingus…
The @apmresearch VOTER PROFILE TOOLS are designed in @tableau, published in @tableaupublic. There are more than 222,000 data points “under the hood” that power the #dataviz. They showcase the latest #ACSdata from the @uscensusbureau.
apmresearchlab.org/representingus…
@APMResearch @tableau @tableaupublic @uscensusbureau 7/
Building them took me about the same time to produce as a squirrel’s gestation period—a little over a month. 🐿️ (While keeping a few other plates spinning.)
apmresearchlab.org/representingus…
Building them took me about the same time to produce as a squirrel’s gestation period—a little over a month. 🐿️ (While keeping a few other plates spinning.)
apmresearchlab.org/representingus…
@APMResearch @tableau @tableaupublic @uscensusbureau 8/
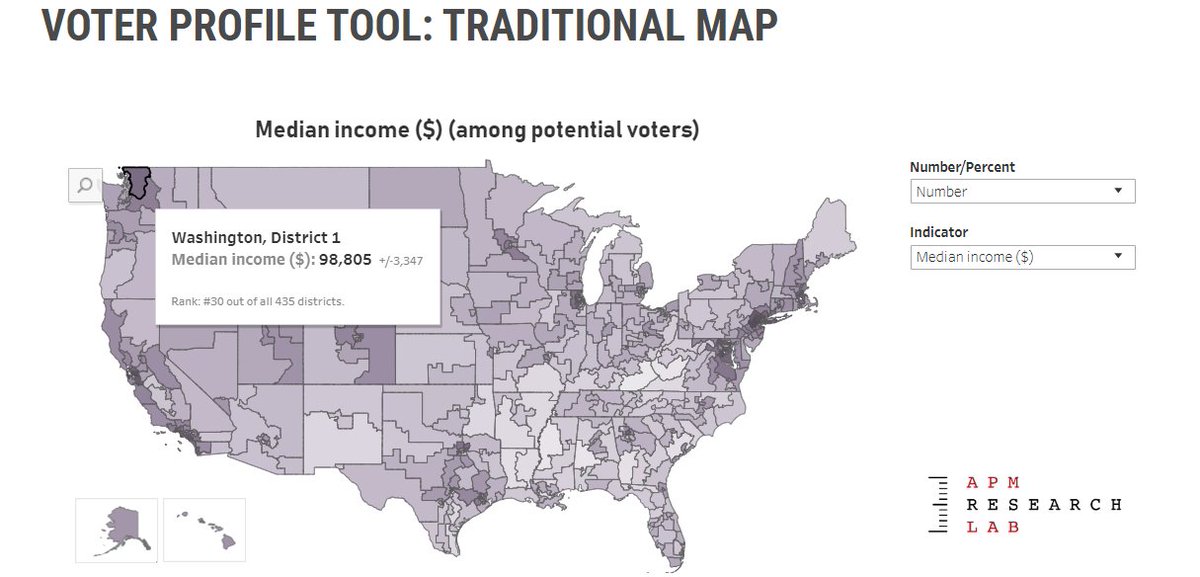
The data wrangling was pretty straight-forward but I labored over how to show populous districts that have a small geographic footprint that are swallowed up by traditional maps. (Never fear, #maplovers, we still made that map, too):
apmresearchlab.org/representingus…
The data wrangling was pretty straight-forward but I labored over how to show populous districts that have a small geographic footprint that are swallowed up by traditional maps. (Never fear, #maplovers, we still made that map, too):
apmresearchlab.org/representingus…
@APMResearch @tableau @tableaupublic @uscensusbureau 9/
This has been a preoccupation of mine since I authored this @apmresearch blog about how I’m really sick of viewing the world through the lens of counties, which are grossly unequal: apmresearchlab.org/blog/the-unequ…
This has been a preoccupation of mine since I authored this @apmresearch blog about how I’m really sick of viewing the world through the lens of counties, which are grossly unequal: apmresearchlab.org/blog/the-unequ…
@APMResearch @tableau @tableaupublic @uscensusbureau 10/
And yet, I knew I was also part of the problem. I mean, I won a @tableau “Viz of the Day” #VOTD for a county-level (!) map on #opioids: apmresearchlab.org/opioids. So yeah, time to stretch to develop some new “containers” to flow data through.
And yet, I knew I was also part of the problem. I mean, I won a @tableau “Viz of the Day” #VOTD for a county-level (!) map on #opioids: apmresearchlab.org/opioids. So yeah, time to stretch to develop some new “containers” to flow data through.
@APMResearch @tableau @tableaupublic @uscensusbureau 11/
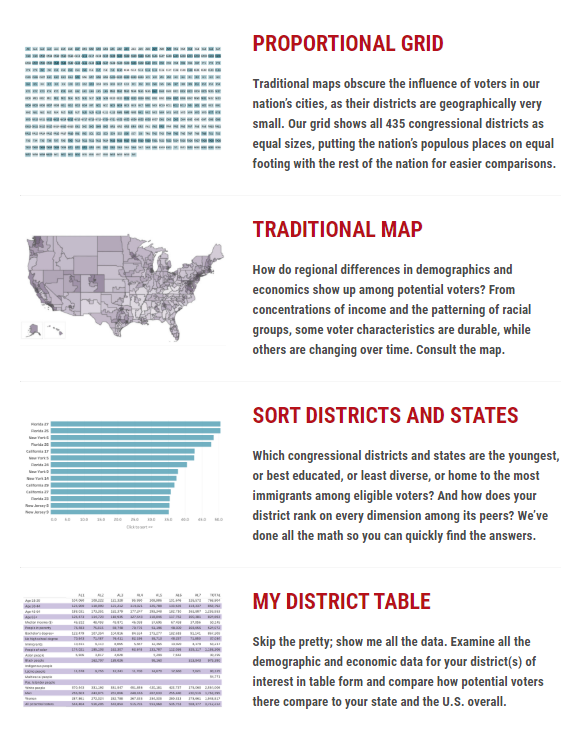
I landed on this fairly simple “proportional grid” showing all 435 #congressional districts as little tiles. With the help of @apmresearch team members Fiona Boler & @benjamingclary, we added a little geographic description (tooltip) to help orient:
apmresearchlab.org/representingus…
I landed on this fairly simple “proportional grid” showing all 435 #congressional districts as little tiles. With the help of @apmresearch team members Fiona Boler & @benjamingclary, we added a little geographic description (tooltip) to help orient:
apmresearchlab.org/representingus…
@APMResearch @tableau @tableaupublic @uscensusbureau @benjamingclary 12/
Yes, it’s fairly simple, but 435 of anything is a lot to try to differentiate visually, so this limited the #dataviz options. Those of you who live in LA, or Boston, or NY actually SHOW UP now in the viz. And that’s SO IMPORTANT.
Yes, it’s fairly simple, but 435 of anything is a lot to try to differentiate visually, so this limited the #dataviz options. Those of you who live in LA, or Boston, or NY actually SHOW UP now in the viz. And that’s SO IMPORTANT.
@APMResearch @tableau @tableaupublic @uscensusbureau @benjamingclary 13/
Despite cliched and trite calls for “heartland values,” American voters in EVERY part of this nation deserved to be seen and heard—both in our #dataviz & but especially by our elected officials. Because we all have VALUES, whether we live by a silo or a skyscraper.
Despite cliched and trite calls for “heartland values,” American voters in EVERY part of this nation deserved to be seen and heard—both in our #dataviz & but especially by our elected officials. Because we all have VALUES, whether we live by a silo or a skyscraper.
@APMResearch @tableau @tableaupublic @uscensusbureau @benjamingclary 14/
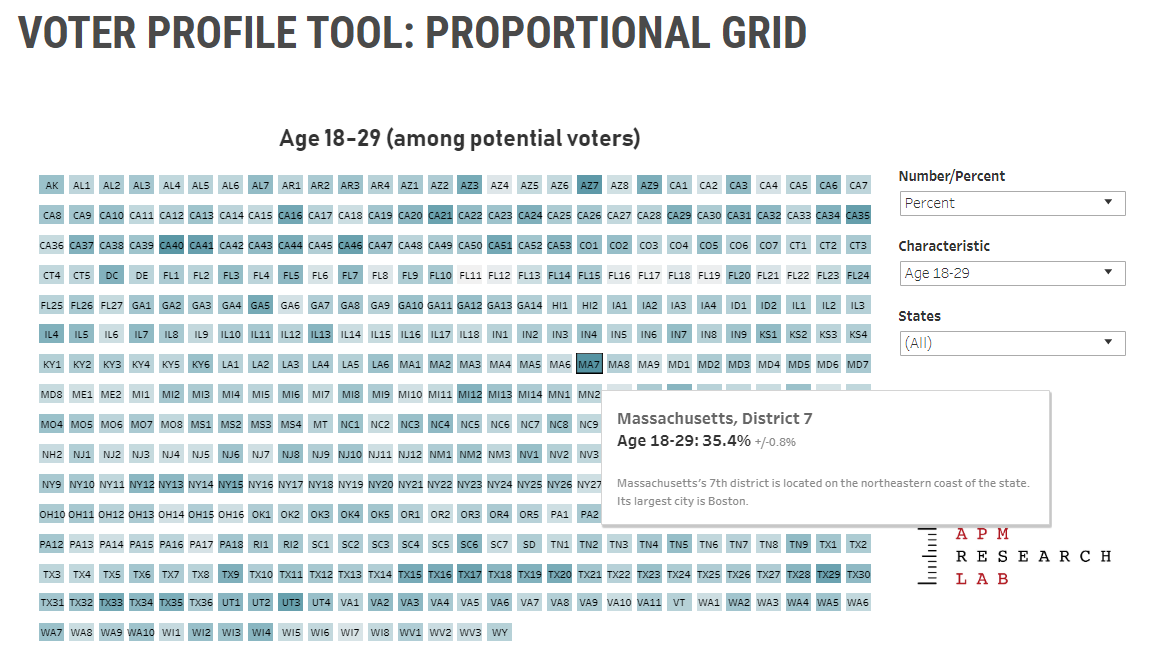
What I love about the grid is how much easier it is to see America’s city-dwellers. If you look at % of potential voters under 30, you can easily locate nation-leading #MA07, Rep. Ayanna Pressley’s district, which includes most of #Boston. @RepPressley @BosPublicRadio @WBUR
What I love about the grid is how much easier it is to see America’s city-dwellers. If you look at % of potential voters under 30, you can easily locate nation-leading #MA07, Rep. Ayanna Pressley’s district, which includes most of #Boston. @RepPressley @BosPublicRadio @WBUR

@APMResearch @tableau @tableaupublic @uscensusbureau @benjamingclary @RepPressley @BosPublicRadio @WBUR 15/
California’s 40th & Arizona’s 7th (near LA & Phoenix) also pop. Along w/ Massachusett’s 7th, these are the ONLY 3 districts where more than 1/3 of all potential voters have yet to have a 30th birthday 🎂. @RepRoybalAllard @RepRubenGallego @RepPressley apmresearchlab.org/representingus…
California’s 40th & Arizona’s 7th (near LA & Phoenix) also pop. Along w/ Massachusett’s 7th, these are the ONLY 3 districts where more than 1/3 of all potential voters have yet to have a 30th birthday 🎂. @RepRoybalAllard @RepRubenGallego @RepPressley apmresearchlab.org/representingus…
@APMResearch @tableau @tableaupublic @uscensusbureau @benjamingclary @RepPressley @BosPublicRadio @WBUR @RepRoybalAllard @RepRubenGallego 16/
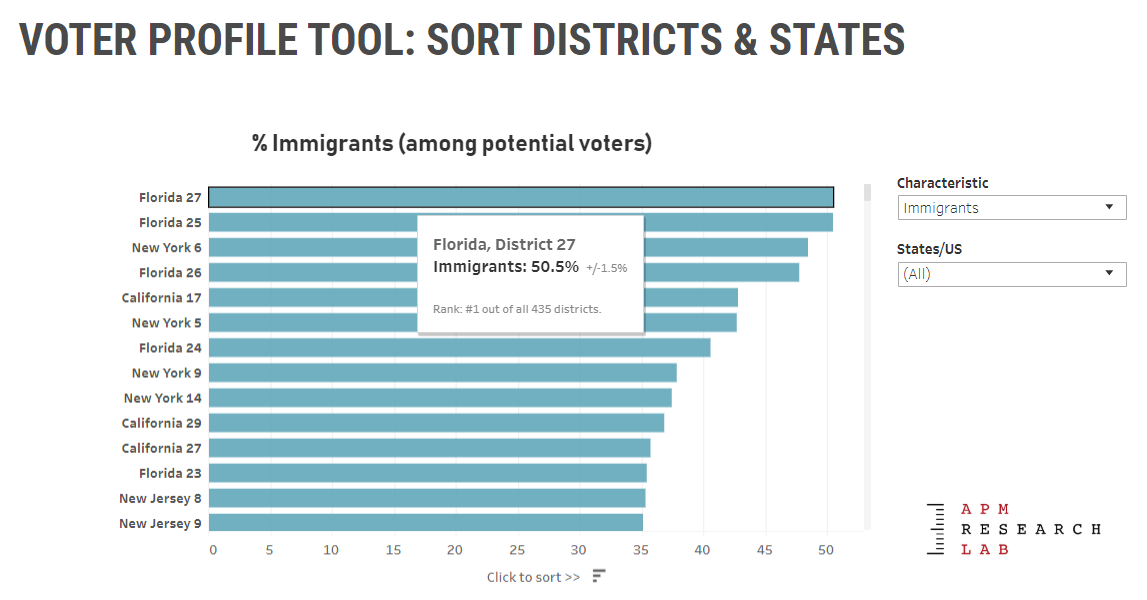
You can also see this in our @apmresearch Sorting tool, which ranks every cong. district & state on potential voter characteristics. E.g., Florida’s 27th & 25th districts are tied for most #immigrants among their eligible voters. apmresearchlab.org/representingus… @RepShalala @MarioDB
You can also see this in our @apmresearch Sorting tool, which ranks every cong. district & state on potential voter characteristics. E.g., Florida’s 27th & 25th districts are tied for most #immigrants among their eligible voters. apmresearchlab.org/representingus… @RepShalala @MarioDB
@APMResearch @tableau @tableaupublic @uscensusbureau @benjamingclary @RepPressley @BosPublicRadio @WBUR @RepRoybalAllard @RepRubenGallego @RepShalala @MarioDB 17/
Prior to coming to help build the new @apmresearch Lab in 2017 with @c_helmstetter, I worked as Asst. Director at the Minnesota State Demographic Center (@mn_statedata) & served as a liaison to the @uscensusbureau as part of the @censusSDC network.
Prior to coming to help build the new @apmresearch Lab in 2017 with @c_helmstetter, I worked as Asst. Director at the Minnesota State Demographic Center (@mn_statedata) & served as a liaison to the @uscensusbureau as part of the @censusSDC network.
@APMResearch @tableau @tableaupublic @uscensusbureau @benjamingclary @RepPressley @BosPublicRadio @WBUR @RepRoybalAllard @RepRubenGallego @RepShalala @MarioDB @c_helmstetter @MN_StateData @censusSDC 18/
While there, I crunched on @uscensusbureau data day & night, which is why I have these “demographic goggles” I wear for my research work. Almost nothing is outside the impact of #demographic variables & influences—age, race, births, deaths, migration--ESPECIALLY #politics.
While there, I crunched on @uscensusbureau data day & night, which is why I have these “demographic goggles” I wear for my research work. Almost nothing is outside the impact of #demographic variables & influences—age, race, births, deaths, migration--ESPECIALLY #politics.
@APMResearch @tableau @tableaupublic @uscensusbureau @benjamingclary @RepPressley @BosPublicRadio @WBUR @RepRoybalAllard @RepRubenGallego @RepShalala @MarioDB @c_helmstetter @MN_StateData @censusSDC 19/
So whether you are trying to interpret demographic differences in political #polls or seeking to understanding voters’ needs, preferences, economic standing & backgrounds…we hope you’ll consult @apmresearch’s VOTER PROFILE TOOLS: apmresearchlab.org/representingus…
#Election2020
So whether you are trying to interpret demographic differences in political #polls or seeking to understanding voters’ needs, preferences, economic standing & backgrounds…we hope you’ll consult @apmresearch’s VOTER PROFILE TOOLS: apmresearchlab.org/representingus…
#Election2020
@APMResearch @tableau @tableaupublic @uscensusbureau @benjamingclary @RepPressley @BosPublicRadio @WBUR @RepRoybalAllard @RepRubenGallego @RepShalala @MarioDB @c_helmstetter @MN_StateData @censusSDC 20/
Special thanks to my @apmresearch colleagues @gabecortes for page design & @c_helmstetter for thoughtful feedback on the #RepresentingUS VOTER PROFILE TOOLS.
Special thanks to my @apmresearch colleagues @gabecortes for page design & @c_helmstetter for thoughtful feedback on the #RepresentingUS VOTER PROFILE TOOLS.
@APMResearch @tableau @tableaupublic @uscensusbureau @benjamingclary @RepPressley @BosPublicRadio @WBUR @RepRoybalAllard @RepRubenGallego @RepShalala @MarioDB @c_helmstetter @MN_StateData @censusSDC @gabecortes 21/
We @APMResearch Lab would ♥️ to hear what you think of our VOTER PROFILE TOOLS (& what else you’d like to see)—whether you’re a #journalist, #media, @tableau #datafam #dataviz member, #politics #nerd, campaign worker or concerned citizen. Reply here or info@apmresearchlab.org
We @APMResearch Lab would ♥️ to hear what you think of our VOTER PROFILE TOOLS (& what else you’d like to see)—whether you’re a #journalist, #media, @tableau #datafam #dataviz member, #politics #nerd, campaign worker or concerned citizen. Reply here or info@apmresearchlab.org
@APMResearch @tableau @tableaupublic @uscensusbureau @benjamingclary @RepPressley @BosPublicRadio @WBUR @RepRoybalAllard @RepRubenGallego @RepShalala @MarioDB @c_helmstetter @MN_StateData @censusSDC @gabecortes 22/
& if you are a #media shop that wants to embed our tools, plz email info@apmresearchlab.org. Thanks!
– Andi & the @APMResearch Lab
@apmdistribution @spj_tweets @journtoolbox @NiemanLab @niemanfdn @Poynter @Mediabistro @NABJ @NAHJ @LatinoUSA @aaja @najournalists @IRE_NICAR
& if you are a #media shop that wants to embed our tools, plz email info@apmresearchlab.org. Thanks!
– Andi & the @APMResearch Lab
@apmdistribution @spj_tweets @journtoolbox @NiemanLab @niemanfdn @Poynter @Mediabistro @NABJ @NAHJ @LatinoUSA @aaja @najournalists @IRE_NICAR


