My Authors
Read all threads
Analysis: #NASDAQ $AMBA

Case 194 #Ambarella Inc.

DISCLAIMER: The analysis is strictly for educational purposes and should not be construed as an invitation to trade.

#AMBA 1/4
Chart 1
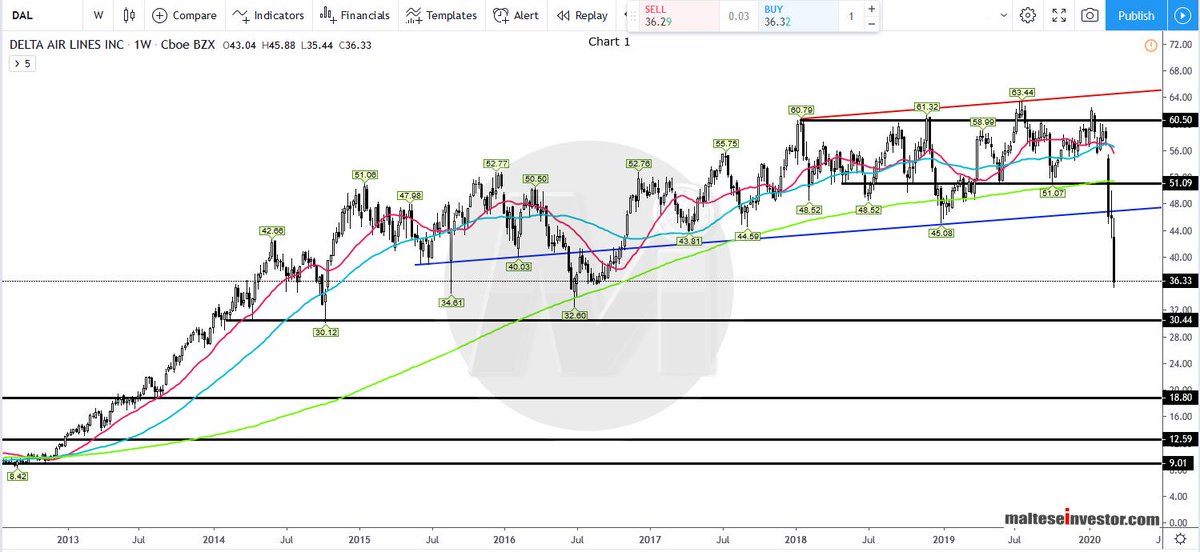
Weekly Chart: Trading has been confined in a 4 year range approximately 74.00 - 32.00 and price has broken below the Nov. 2018 #trendline and now targeting 36.20. A close below latter will eye 31.30 and then .....

AMBA 2/4
..... 28.40. The SMAs are negative and pointing down, resistance begins at 47.80 (2018 trendline) then 52.90 - 53.80 (#Pivot, #Fib and #SMA 200).

AMBA 3/4
Chart 2
Daily Chart: The #Strategy is printed on the image.

$AMBA 4/4
Missing some Tweet in this thread? You can try to force a refresh.

Enjoying this thread?

Keep Current with malteseinvestor

Profile picture

Stay in touch and get notified when new unrolls are available from this author!

Read all threads

This Thread may be Removed Anytime!

Twitter may remove this content at anytime, convert it as a PDF, save and print for later use!

Try unrolling a thread yourself!

how to unroll video

1) Follow Thread Reader App on Twitter so you can easily mention us!

2) Go to a Twitter thread (series of Tweets by the same owner) and mention us with a keyword "unroll" @threadreaderapp unroll

You can practice here first or read more on our help page!

Follow Us on Twitter!

Did Thread Reader help you today?

Support us! We are indie developers!


This site is made by just three indie developers on a laptop doing marketing, support and development! Read more about the story.

Become a Premium Member ($3.00/month or $30.00/year) and get exclusive features!

Become Premium

Too expensive? Make a small donation by buying us coffee ($5) or help with server cost ($10)

Donate via Paypal Become our Patreon

Thank you for your support!