
DISCLAIMER : This is for educational purpose and not financial advise.
Monthly market analysis Oct 31, 2022
#StockMarket #DowJones best month since 1976
Let's look at more closely 🧵👇
Monthly market analysis Oct 31, 2022
#StockMarket #DowJones best month since 1976
Let's look at more closely 🧵👇
1. After technical oversold and very negative sentiment in Sep month, #StockMarket was finally able to reverse direction this month. $DJIA had the best month since 1976 (+14%). $NDX was underperformed (5%) compared to $SPX (8.8%), $RUT(11%).
https://twitter.com/boyz_meta/status/1577107089163309057?s=20&t=JMe7IZovnOP9E5GmpH-MvA
2. Let's look at US 10Y #Bond Yield price action. It was very volatile and tested 4.3% Jun'08 high before reversing -9.8% to the end of the month. This month it finished up 5.7%. RSI did not make new high at Oct 21 when it reached peak 4.33% (bearish reversal)
#StockMarket
#StockMarket

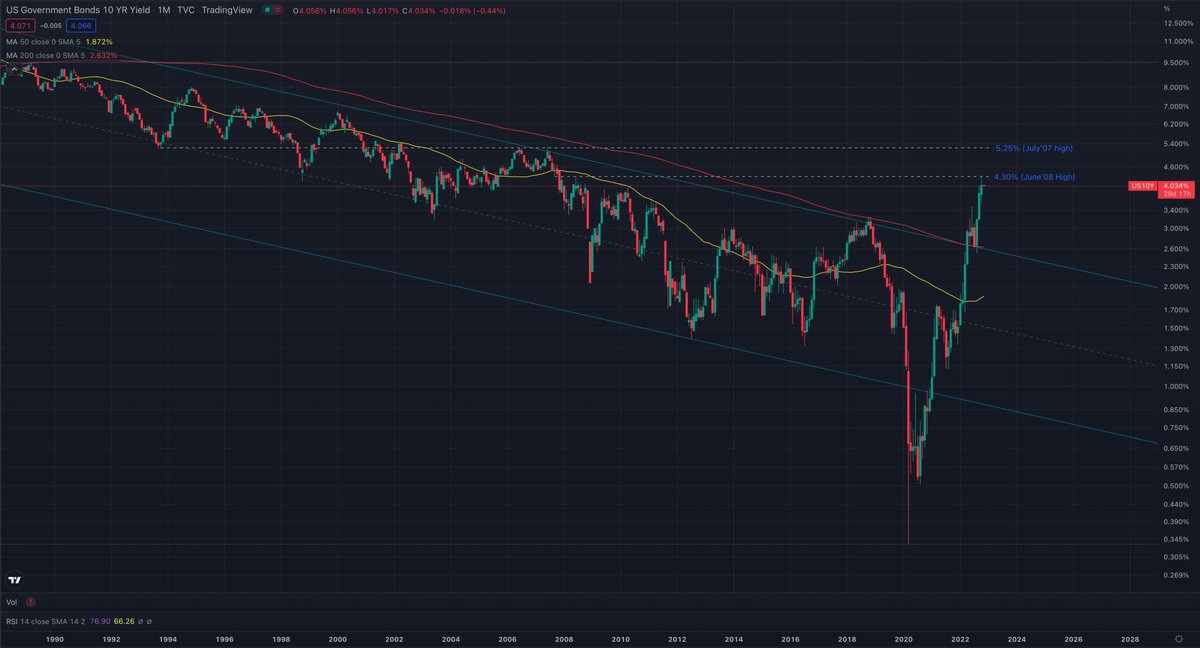
3. Long term log chart of US 10Y #Bond Yield breaks its long term downtrend channel to the upside after a huge reversal from the bottom of pandemic Mar'20.
There is major resistance at 5.25% from July'07 high which we do not want to go there in the short-term.
#StockMarket
There is major resistance at 5.25% from July'07 high which we do not want to go there in the short-term.
#StockMarket
4. US 2Y #Bond Yield also made new high this month and up about 4.7%. It hit its peak of 4.639% on Oct 21 but RSI did not make new high (bearish reversal) and made a huge reversal -8.0% to last week of Oct. Currently it is trending down to 50MA(yellow)
#StockMarket
#StockMarket

5. Long term chart of US 2Y #Bond Yield has a resistance between 5% - 5.3%. RSI is very overbought, but it could stay overbought for more than a year similar to 2017-2018.
#StockMarket
#StockMarket

6. The inverted yield curve between US 10Y(blue) - 02Y(orange) #Bond Yield, it's getting wider every month. Short-term rate is still depending on #Fed rate hike and long term rate is predicting economy slow down where we could have #recession or #stagflation
#StockMarket
#StockMarket

7. UK 10Y #gilt has dramatic reversal in Oct and it was down almost 14%. It reached its peak at 4.6% in Oct, but RSI did not make a new high (bearish reversal). It made a huge reversal after blow off top at Oct 12 and down more than 27% from the peak to trough
#StockMarket
#StockMarket

8. The spread between Italy 10Y #Bond Yield(orange) with Germany 10Y Bund Yield(blue) has stabilized this month to slightly narrower compared with couple months ago.
#StockMarket
#StockMarket

9. Similarly the spread between France 10Y #Bond Yield(orange) with Germany 10Y Bund Yield(blue) also has stabilized compared to prior couple months.
#StockMarket
#StockMarket

10. US SPDR High Yield Junk #Bond $JNK made new low on Oct 13, but RSI did not make a new low (bullish reversal). It's up 2.5% this Oct month and testing 50MA(yellow) resistance.
#StockMarket
#StockMarket

11. US @iShares Corporate High Yield #Bond #ETF $HYG also made new low on Oct 13 and RSI did not make a new low (bullish reversal). It's up more than 2.8% and testing 50MA(yellow) resistance
#StockMarket
#StockMarket

12. Now looking at $DXY (USD Index), it did not make new high in Oct after a reversal in the last week of Sep. So far RSI has been reset and 50MA resistance is still being defended. This month, it was only down 0.5% even though, its peak to trough range was -3.8%
#StockMarket
#StockMarket

13. Long term chart of $DXY still very bullish with major resistance at 120 July'01 high. RSI is very overbought but it could stay overbought for another year or so similar to 2014-2015 timeframe
#StockMarket
#StockMarket

14. #EURUSD stabilized this month and did not make a new low in Oct after it broke June'89 low in Sep month. RSI made new low in Sep and it could stay oversold for another year or so.
#StockMarket
#StockMarket

15. After it broke Feb'85 low in Sep, #GBPUSD was able to reverse higher and did not make a new low this Oct month. It finished higher 2.7% this month and oversold RSI was able to reverse.
#StockMarket
#StockMarket

16. #USDJPY keeps making new high including in Oct month. RSI is very overbought and next major resistance would be 160. Bank of Japan has been less hawkish compare to US #FederalReserve and keep maintaining their quantitative easing.
#StockMarket
#StockMarket

17. Looking at $VIX ( $SPX Fear Index) this month, it did not make a new high after making its high in Sep 28 and made a reversal. This month #volatility was crushed -18% and broke down below 50MA and 200MA. RSI didn't make new high and getting in oversold territory
#StockMarket
#StockMarket

18. NYSE Advance/Decline Daily Chart was very volatile this month. It had huge advance volume spike in the first week of the month, then made intraday reversal when #StockMarket bottom on Oct 13. Followed by another huge advance volume couple days after.

19. #AAII Bull Sentiment Idx Weekly Chart after making low at the end of Sep, it finally reversed this month and reset the oversold condition. It is no longer extreme pessimism sentiment now.
#StockMarket
#StockMarket

20. #AAII Bear Sentiment Idx Weekly Chart also has been reset from overbought RSI and very bearish sentiment at the end of Sep to about mid level.
#StockMarket
#StockMarket

21. NYSE percent stocks > 200MA made a huge reversal at the end of Sep to the end of Oct similar pattern to the time frame of June low to Aug high. At the end of this month, number of stocks >200MA (36%) is no longer oversold.
#StockMarket
#StockMarket

22. $SPX Put/Call ratio after making high at the end of Sep, trader started covering their short at the beginning of Oct especially after huge 2 days volume reversal 1st week of the month. Then trader started piling up into short again until market bottom at Oct 13.
#StockMarket
#StockMarket

23. Now let's look at macro economy data.
Consumer Confident Index (CCI) from EuroZone, USA, and UK show mixed signal. US CCI has been stabilized and picked up since June-July bottom, but the rest of nations still down
Note: This is lagging data up to Sep 2022
#StockMarket
Consumer Confident Index (CCI) from EuroZone, USA, and UK show mixed signal. US CCI has been stabilized and picked up since June-July bottom, but the rest of nations still down
Note: This is lagging data up to Sep 2022
#StockMarket

24. Business Confident Index (BCI) from EuroZone, USA, UK are trending quite similar and keep going down after high from last year
Note: This is lagging data up to Sep 2022
#StockMarket
Note: This is lagging data up to Sep 2022
#StockMarket

25. Small Business Optimist Index has been improving since June/July low of 89. #inflation is still the most important problem in their operating report.
Note: Oct report would be released second Tuesday of the month
#StockMarket
Note: Oct report would be released second Tuesday of the month
#StockMarket

26. US #ISM Manufacturing Index in Oct still shows slower growth but not below 50 yet (contraction). New order and manufacturing employment still show no contraction what #FederalReserve hopes for.
#StockMarket
#StockMarket

27. US #ISM Non-Manufacturing or Service Index in Oct also shows slower growth but no contraction yet. Business activity and new order are still growing albeit slower including the overall economy, but services employment starts to show contraction
#StockMarket
#StockMarket

28. US #GDP 3rd quarter is trending down again this last quarter but not contraction yet
Updated: Oct 27, 2022
#StockMarket
Updated: Oct 27, 2022
#StockMarket

29. US Real #GDP (Inflation Adjusted) in Q3 is trending up slightly after downtrend from Q1 to Q2 this year.
Updated: Oct 27,2022
#StockMarket
Updated: Oct 27,2022
#StockMarket

30. US unemployment rate still shows very healthy and strong labor market which is contradicting from what #FederalReserve wants to achieve for stopping rate hikes.
Updated: Oct 7, 2022
#StockMarket
Updated: Oct 7, 2022
#StockMarket

31. US Personal Consumption Expenditures (#PCE) Index is still stubbornly high even though it is trending down on monthly basis
Updated: Oct 28, 2022
#StockMarket
Updated: Oct 28, 2022
#StockMarket

32. US Consumer Price Index (#CPI) has started to reverse a little bit but still quite high for the past 12 month. CPI for all items rises 0.4% in September as shelter and food increase, gasoline falls
Updated: Oct 13, 2022
#StockMarket #inflation
Updated: Oct 13, 2022
#StockMarket #inflation

33. Fed Fund Rate has been trending up since March'22 and the fastest #ratehike trajectory for a while. So far there is no indication of slowing down anytime soon considering strong labor market and wage growth
#StockMarket #FederalReserve
#StockMarket #FederalReserve

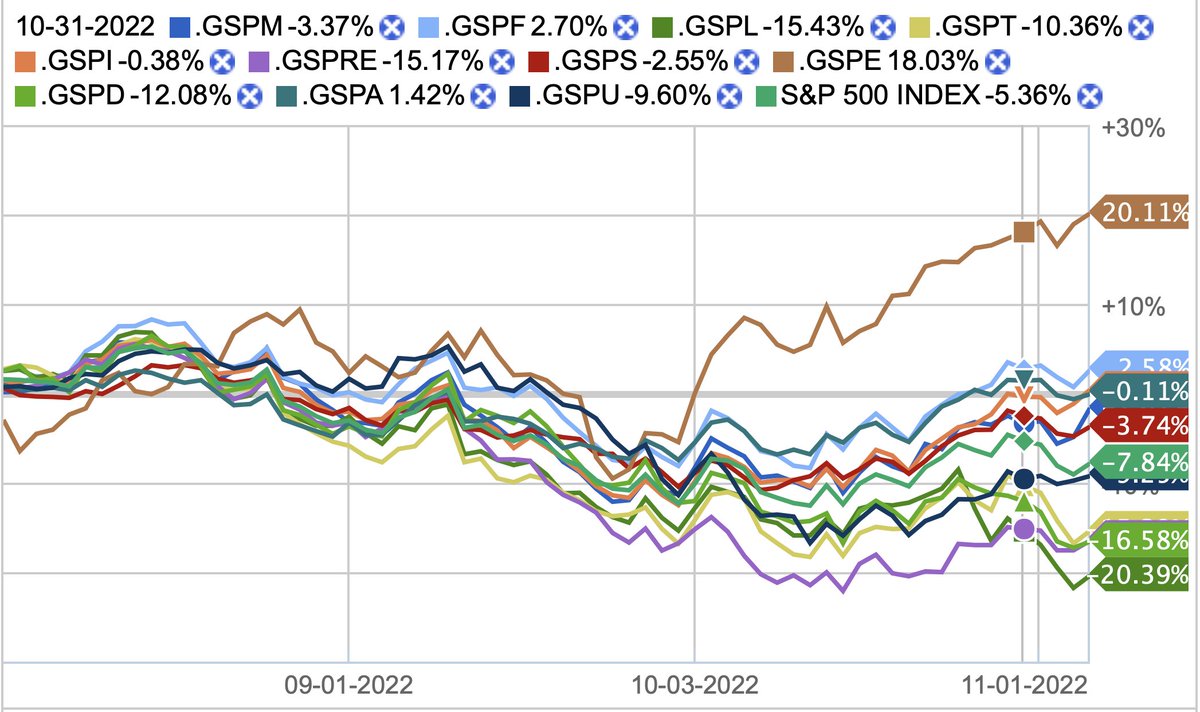
34. Now let's look at US market. Again Energy sector is outperformance this Oct (+25%) and Communication Services is bottom performance (-0.1%) as it is dominated by all big cap tech. Overall SPX returns this month +8%
#StockMarket
#StockMarket
35. /ES ( $SPX Future) had volatile move this month,but it's up almost +8%. It made new low of this year after breaching June low and had huge intraday reversal, but RSI did not make new low (bullish reversal). It closed above 50MA(yellow) this month
#StockMarket
#StockMarket

36. /NQ ( $NDX Future) was underperformance (+4%) compared to other indexes due to large components of FAANG stocks. It also made new low 10480 after violating June low, but RSI did not confirm new low (bullish reversal). It's not able to defend 10.5K level.
#StockMarket
#StockMarket

37. Looking at /GC (#Gold Future), it has interesting Oct price action. It tested Sep low and didn't violate, but RSI did not confirm new low (bullish reversal). It's still traded within downtrend channel and need to break 50MA(yellow) for upside resistance
#StockMarket
#StockMarket

38. /CL (#Oil Future) did not make a new low after reversal at last week of Sep and RSI has been reset to neutral level. It's able to recapture 50MA(yellow) and broke its downtrend channel. Finished strongly about +9%
#StockMarket
#StockMarket

39. $SMH Semiconductor #ETF had weak performance this month. It made new low after violating June low, but RSI did not confirm new low (bullish reversal). It finished +2% this month but still not able to break June low and 50MA(yellow) resistance
#StockMarket
#StockMarket

40. Comparing /ES ( $SPX Future) with US 10Y (orange) and 02Y (yellow) #Bond Yield. Their price actions are still correlate together. Every time #bond yield makes new high, market is down and vice versa.
#StockMarket
#StockMarket

41. $EEM Emerging Market #ETF correlation with $DXY (#USD Index). It finished -2% this month; even though $DXY was about flat this month. Top 10 holding of $EEM are mainly China tech stocks that got crushed till end of Oct
#StockMarket
#StockMarket

42. $BTC had good performance this month (+5.5%). It never violated June low and still defending 18.6K-18.7K level. RSI also did not make new low and trending up. It's able to close this Oct month above 50MA(yellow)
#cryptomarket #Bitcoin #BTC
#cryptomarket #Bitcoin #BTC

43. $ETH had very strong month in Oct. It finished staggering +18% and never made a new low. It defended 1275 level and closed above 50MA(yellow) to almost test 200MA(red). In fact, it invalidated the forming H/S pattern. Alas, RSI is overbought now.
#cryptomarket #ETH #Ethereum
#cryptomarket #ETH #Ethereum

44. $ETHBTC ETH/BTC ratio had strong performance this month (+11%) After testing Sep low and defended 200MA(red), it was able to close the month way above 50MA(yellow). Unfortunately RSI is overbought now
#cryptomarket #Ethereum #Bitcoin
#cryptomarket #Ethereum #Bitcoin

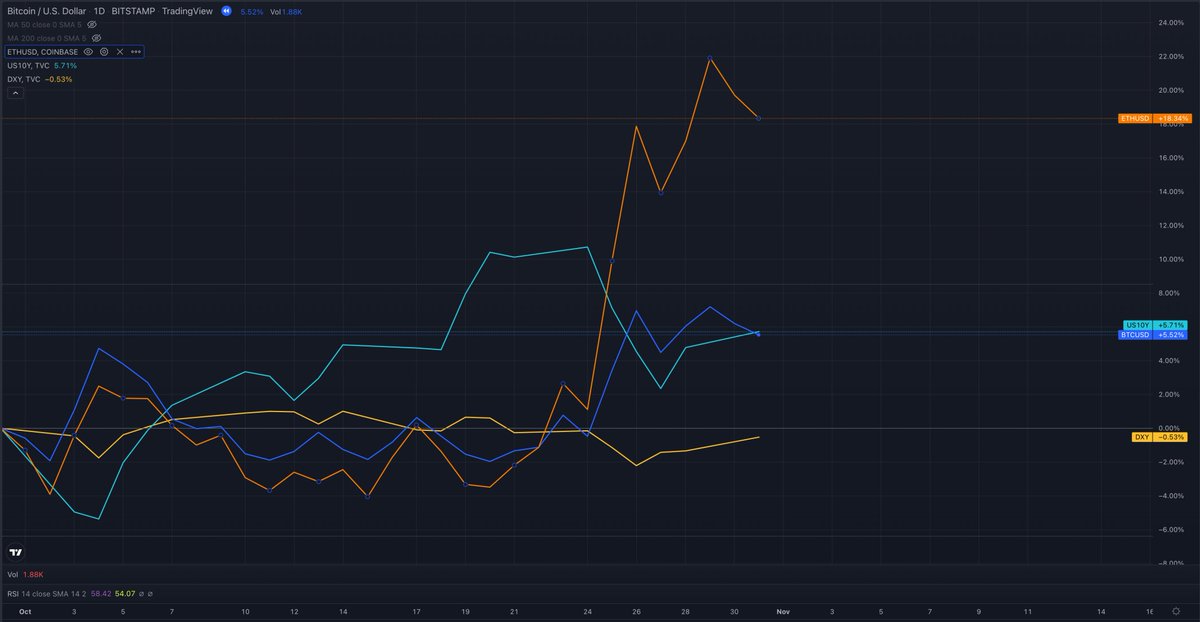
45. Comparing #ETH #BTC $DXY and US 10Y #Bond Yield has very interesting point this month. Even though, #Bond yield was up about +6%, but $BTC $ETH still outperformed by a mile. It remains to be seen if it can maintain this momentum for the next several months.
#cryptomarket
#cryptomarket
46. Now comparing #ETH #BTC $SPX Future $NDX Future and US 10Y #Bond Yield. $ETH outperformed all indexes. Again #Bond Yield was up +5% this month, but #cryptomarket and #StockMarket able to outperform due to anticipation of Fed "pivot" or pause.

47. Important:
1. Oct is reversal month after disastrous Sep due to extreme negativity
2. Most of the indicators had bullish reversal even after made new low this month due to bullish seasonality end of the year
#StockMarket #cryptomarket
1. Oct is reversal month after disastrous Sep due to extreme negativity
2. Most of the indicators had bullish reversal even after made new low this month due to bullish seasonality end of the year
#StockMarket #cryptomarket
3. Most of RSI indicators have been reset and no longer oversold
4. Market participant still expecting and wanting #FederalReserve to pivot or pause
5. Economy indicators are still showing no contraction albeit geting slower month over month
#StockMarket #cryptomarket
4. Market participant still expecting and wanting #FederalReserve to pivot or pause
5. Economy indicators are still showing no contraction albeit geting slower month over month
#StockMarket #cryptomarket
6. Bad news are still good news for market direction.
7. Remain to be seen if Nov will follow Oct performance due to #FOMC and Midterm #Election
8. Be careful of bull trap. #Fed still persistent on rate hike as wage growth and employment are strong
#StockMarket #cryptomarket
7. Remain to be seen if Nov will follow Oct performance due to #FOMC and Midterm #Election
8. Be careful of bull trap. #Fed still persistent on rate hike as wage growth and employment are strong
#StockMarket #cryptomarket
9. Be careful of bear trap. It's seasonally bullish quarter especially during or after Midterm Election. Any indication or Fed "pivot" or pause, Russia/Ukraine war cease-fire, China relaxing zero covid policy would cause market to short squeeze
#StockMarket #cryptomarket
#StockMarket #cryptomarket
10. Always pay attention to global #bond yield and how strong #USD is. These still dictates global market direction
11. Be mindful. “Markets can stay irrational longer than you can stay solvent." Cheers.
#StockMarket #cryptomarket
11. Be mindful. “Markets can stay irrational longer than you can stay solvent." Cheers.
#StockMarket #cryptomarket
@threadreaderapp unroll
• • •
Missing some Tweet in this thread? You can try to
force a refresh


