🚨🌍 Global Carbon Budget 2022, out now!🌍🚨
It provides the latest update on how we humans have tampered with Earth's remarkable system of #carbon stocks and flows.
So what are the take-homes from our latest update?
@gcarbonproject @PFriedling
It provides the latest update on how we humans have tampered with Earth's remarkable system of #carbon stocks and flows.
So what are the take-homes from our latest update?
@gcarbonproject @PFriedling

It's a story of persistent high global #CO2 emissions, but with some hints (and some hope!) that *total* human #emissions are levelling off.
(Although with considerable uncertainty in the land use change emissions).
(Although with considerable uncertainty in the land use change emissions).

But did anyone mention that we need to get that red line 👆 to hit zero to meet the commitments made in #Paris?
👇
👇

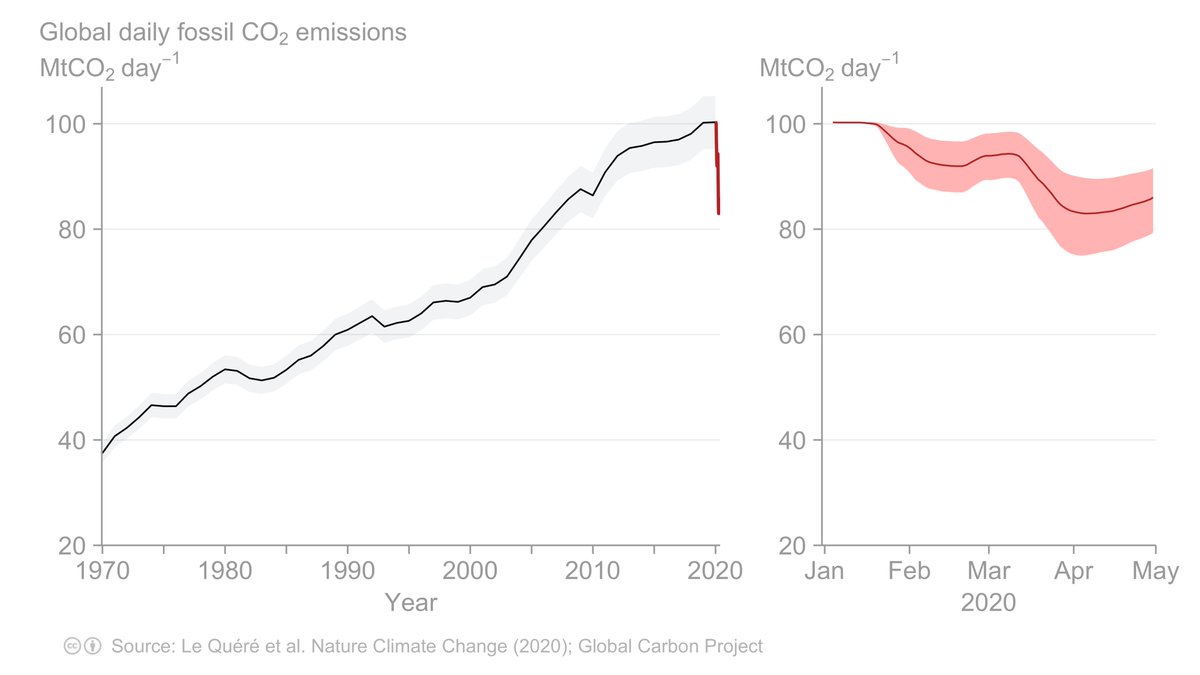
The pandemic led to a sharp decline in #fossil CO2 #emissions, but an almost equally sharp rebound in 2021 and a further 1% rise in 2022. Hence 2022 is a new *record year* for fossil CO2 emissions.
... Not the first time that global events have all-too-briefly pierced the trend.
... Not the first time that global events have all-too-briefly pierced the trend.


There are nuggets of good news on national scales. In 2022, #fossil CO2 #emissions reduced in #China and the #EU.
... but those reductions were counteracted by increased emissions from #India, the #US and elsewhere.
... but those reductions were counteracted by increased emissions from #India, the #US and elsewhere.
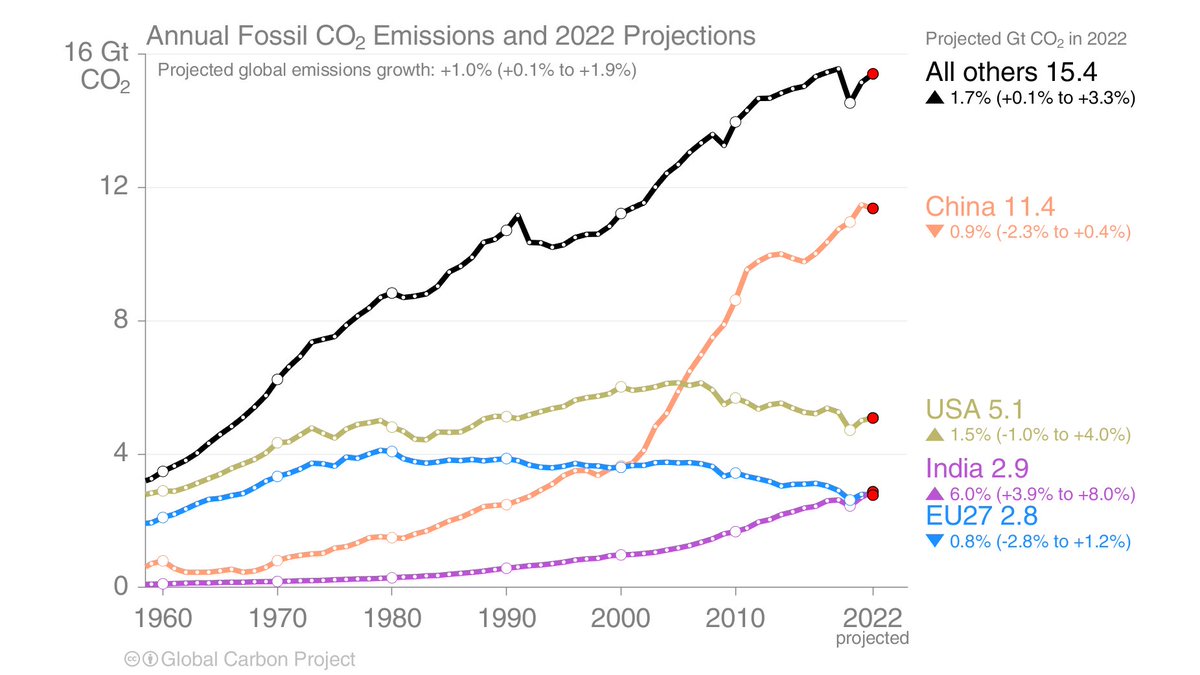

Globally, #emissions from #coal and #oil grew in 2021 and 2022, whereas emissions from #gas fell slightly after their 2021 rebound.


Lurking behind those global numbers are some pretty spectacular increases in #emissions from #coal in #India (+5% from '21 to '22) and the #EU (+6.7%).

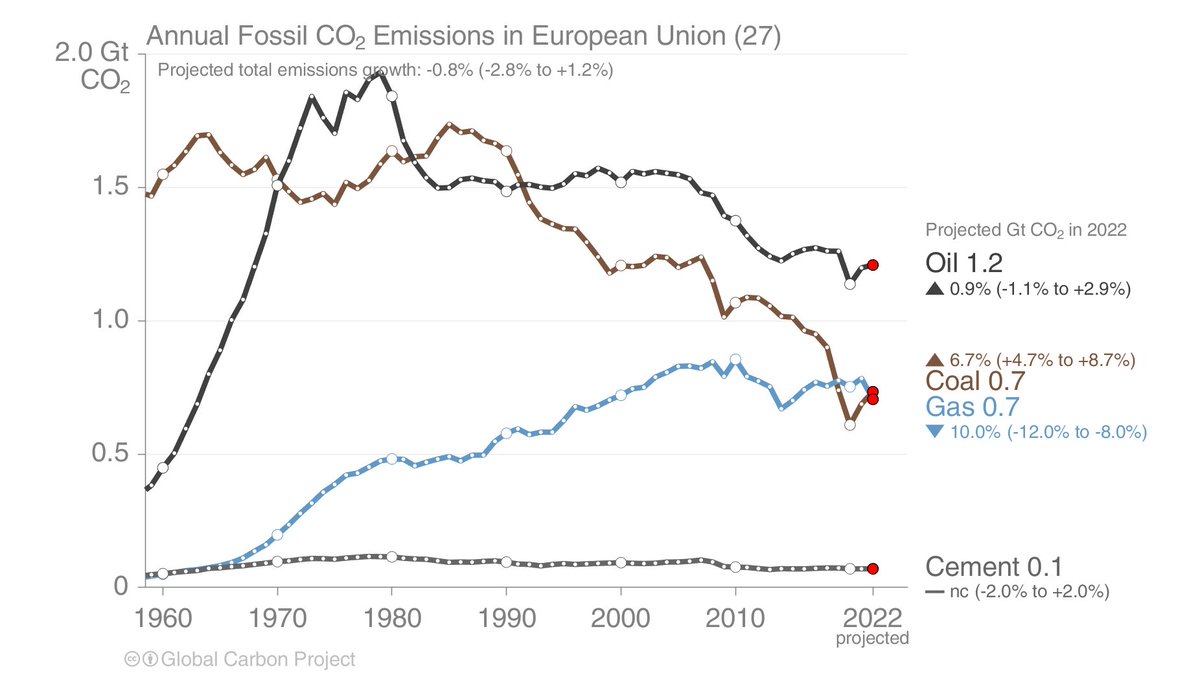
In the #EU, reduced #gas (-10%) emissions were countered by growth in #coal emissions (+6.7%) between '21 & '22.
No prizes for guessing why ... 🇺🇦
A related increase in emissions per unit energy added to the increased emissions caused by the post-pandemic economic rebound.
No prizes for guessing why ... 🇺🇦
A related increase in emissions per unit energy added to the increased emissions caused by the post-pandemic economic rebound.


The latest changes in fossil CO2 #emissions are superimposed on vastly different baseline rates of emissions and inequitable emissions per capita across countries.
e.g. #US per capita emissions are falling, yet still 3x the global mean, and >2x the mean in the #EU.
e.g. #US per capita emissions are falling, yet still 3x the global mean, and >2x the mean in the #EU.


Some good news. (Maybe.)
There are promising signs of a decline in global #land use change #emissions.
Although these estimates come with the highest uncertainty of any component of the global carbon budget.
There are promising signs of a decline in global #land use change #emissions.
Although these estimates come with the highest uncertainty of any component of the global carbon budget.

National #emissions estimates for #land use change are an exciting new feature of this year's budget.
#Indonesia and #Brazil have contributed ~45% of the global emissions (past decade).
Land use change emissions declined steadily in Brazil since ~2005.
#Indonesia and #Brazil have contributed ~45% of the global emissions (past decade).
Land use change emissions declined steadily in Brazil since ~2005.

The plots above all show *net* land use change #emissions; the balance of emissions from #deforestation and landscape degradation, and sinks via re/afforestation and wood harvest.
Over the past decade, the sinks counterbalanced ~half of deforestation/degradation emissions.
Over the past decade, the sinks counterbalanced ~half of deforestation/degradation emissions.

#Land use change #emissions have contributed ~10% of the total #CO2 emissions in recent years.
However, land use change continues to be a historically significant source of CO2 to the atmosphere (~30% of the total).
However, land use change continues to be a historically significant source of CO2 to the atmosphere (~30% of the total).


What is the fate of all this #CO2 that we've chucked into the atmosphere?
A quirk of our planet's system, which we should all be thankful for, is that only ~half of human emissions remain in the atmosphere (so far).
A quirk of our planet's system, which we should all be thankful for, is that only ~half of human emissions remain in the atmosphere (so far).

The #land and #oceans dampen our impact on atmospheric #CO2 by ~53%
Over the past decade, land took up ~29% of human emissions, and the oceans ~26%.
Over the past decade, land took up ~29% of human emissions, and the oceans ~26%.
The land #sink (to land which has escaped use by humans) continues to rise in response #CO2 fertilisation (CO2 being plant food, and all).
Removals through enhanced vegetation growth outweigh #emissions from land use change.
Removals through enhanced vegetation growth outweigh #emissions from land use change.

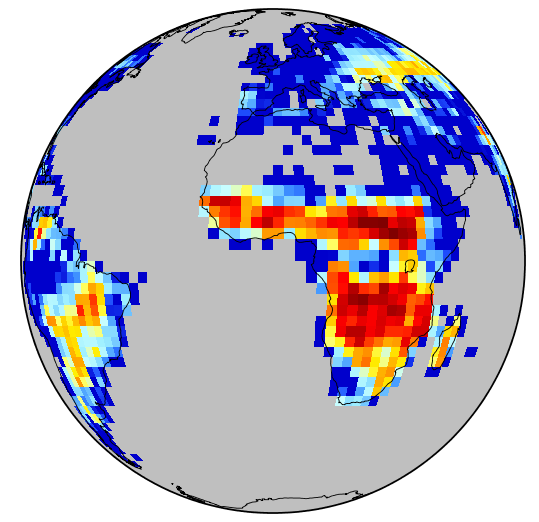
Worth noting, however, that the effect of #climate change, caused by historical emissions, has been to suppress the lank sink (the "red zones" 👇).
Some places are neutral, or net sources - due to the pressures that #climate change brings (e.g. drought, fire...)
Some places are neutral, or net sources - due to the pressures that #climate change brings (e.g. drought, fire...)

The #ocean sinks have also grown as the #CO2 concentration gradient between the #atmosphere and ocean waters has sharpened.
The absorption of emitted #CO2 by the oceans brings problems like ocean acidification, but it prevents even higher concentrations of CO2 in the atmosphere.
The absorption of emitted #CO2 by the oceans brings problems like ocean acidification, but it prevents even higher concentrations of CO2 in the atmosphere.

The net balance of all these #CO2 #emissions and #sinks?
An added ~19 billion tonnes of CO2 in the #atmosphere during the past decade, with ~40 billion tonnes emitted by humans and ~22 billion tonnes removed by the #land and #ocean sinks (past decade).
An added ~19 billion tonnes of CO2 in the #atmosphere during the past decade, with ~40 billion tonnes emitted by humans and ~22 billion tonnes removed by the #land and #ocean sinks (past decade).


... And the main reason that many regions are already facing a rising risk of #heatwaves, #droughts, #fires and #floods (to name just a few!). 👇
https://twitter.com/Jones_MattW/status/1542505661895802881
Building a global picture of the #carbon budget takes a huge investment of time from diverse research communities - hundreds of contributions.
Together, we keep track of this planet's carbon pulse.
@gcarbonproject @PFriedling @clequere @Peters_Glen @robbie_andrew @pepcanadell
Together, we keep track of this planet's carbon pulse.
@gcarbonproject @PFriedling @clequere @Peters_Glen @robbie_andrew @pepcanadell

@JudithHauck @LuijkxIngrid @ciais_philippe @ilitat @LiuzhuLiu @GuidovanderWerf @becci_wright @soenke_zaehle
@UEAResearch @TyndallCentre @ueaenv
With special thanks to @robbie_andrew for putting an impressive set of extra figures!
@UEAResearch @TyndallCentre @ueaenv
With special thanks to @robbie_andrew for putting an impressive set of extra figures!
Always thank your funders!! ...🤦♂️
A huge thanks to @NERCscience for supporting my contribution to this year's global carbon budget 🙏
@UKRI_News
A huge thanks to @NERCscience for supporting my contribution to this year's global carbon budget 🙏
@UKRI_News
• • •
Missing some Tweet in this thread? You can try to
force a refresh