This is a long thread (I might release an abridged version), but it's quite important I think.
I know some will not make it to the end, so let me be absolutely clear upfront. This claim is a fantasy! It's not based on reality.
People are being misled!
Let me explain why.
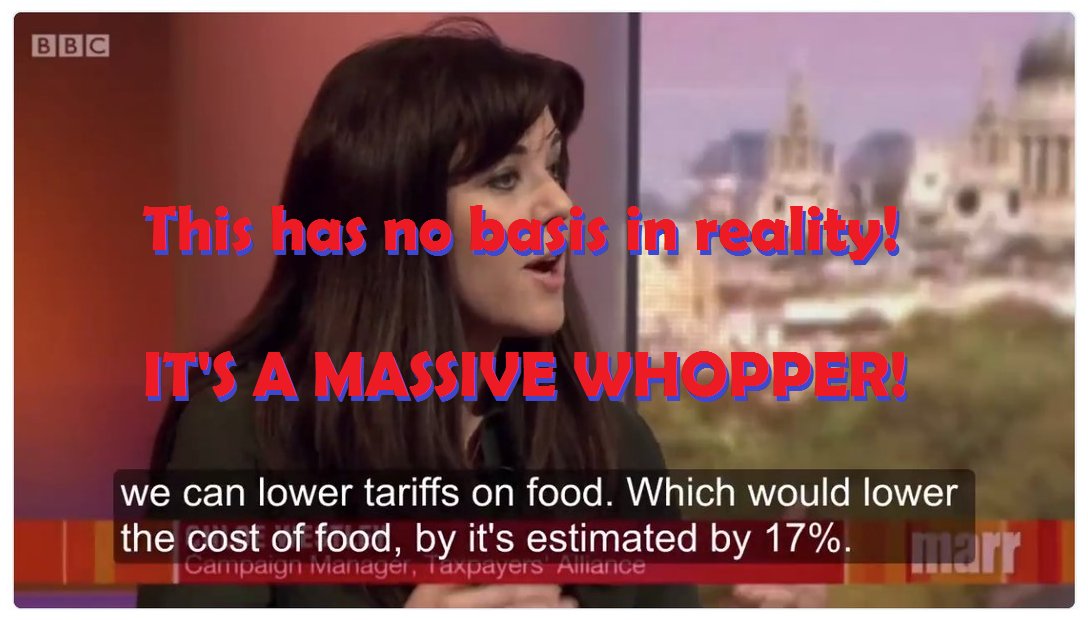
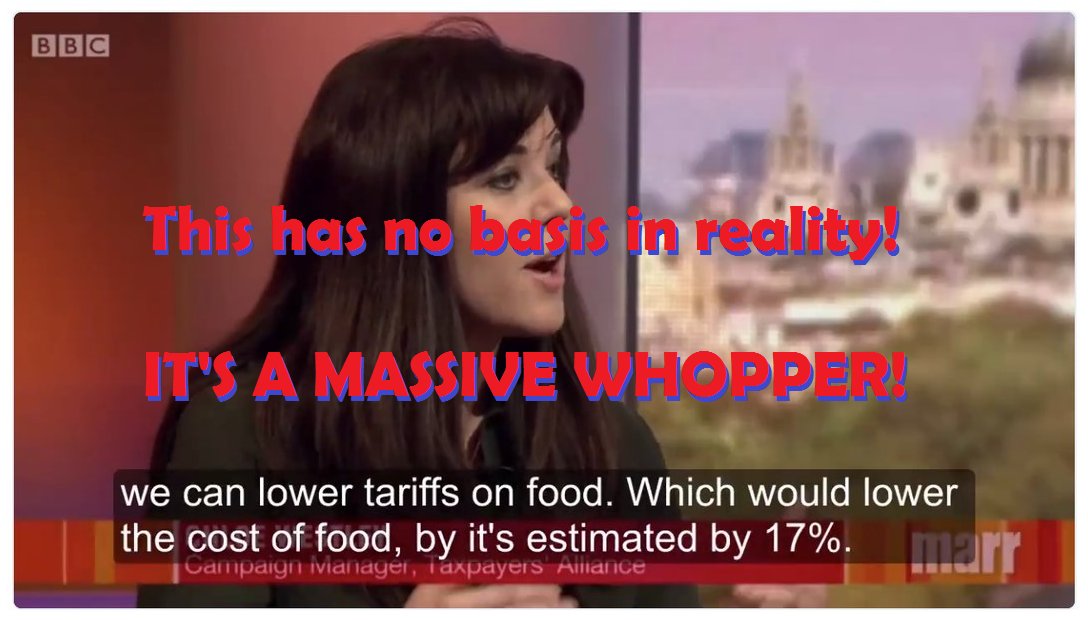
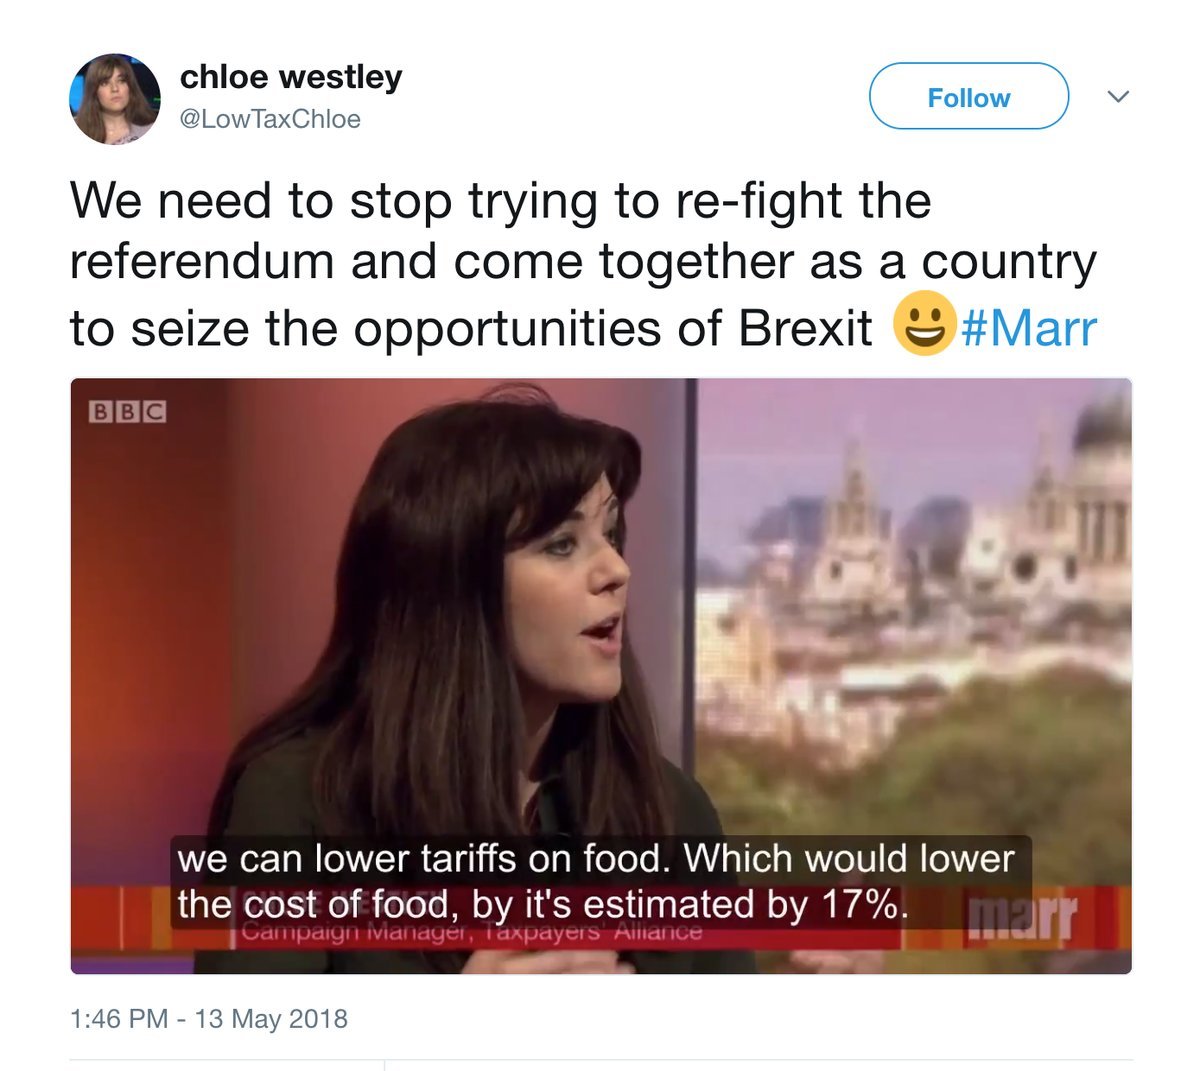
On Sun 13 May @LowTaxChloe appeared on the @MarrShow as a paper reviewer and said that outside of the Customs Union "we can lower tariffs which would reduce the cost of food by an estimated 17%."
As often happens the claim went unchallenged by host @bbcnickrobinson.
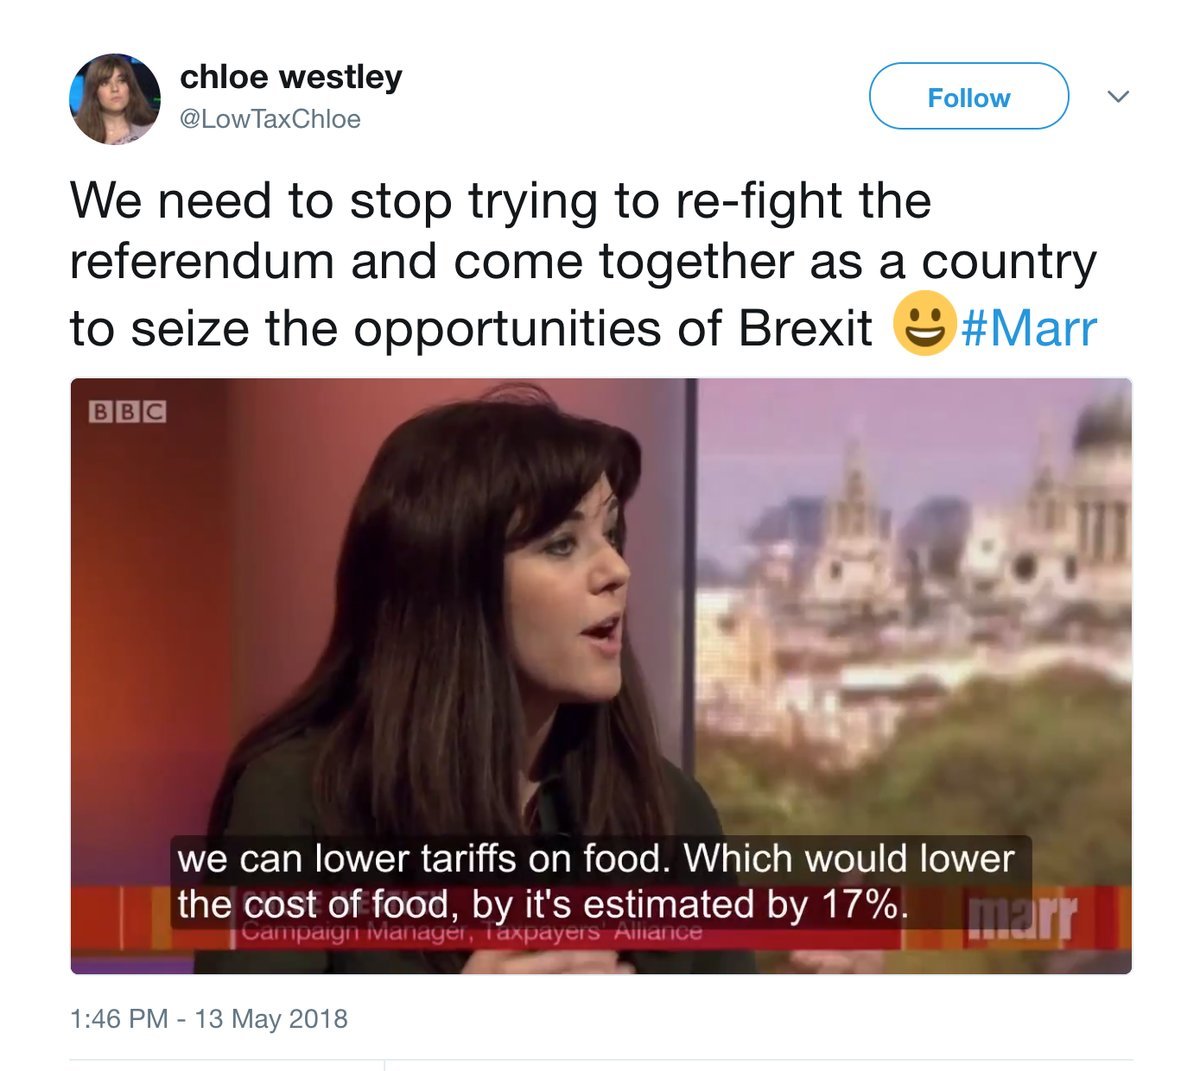
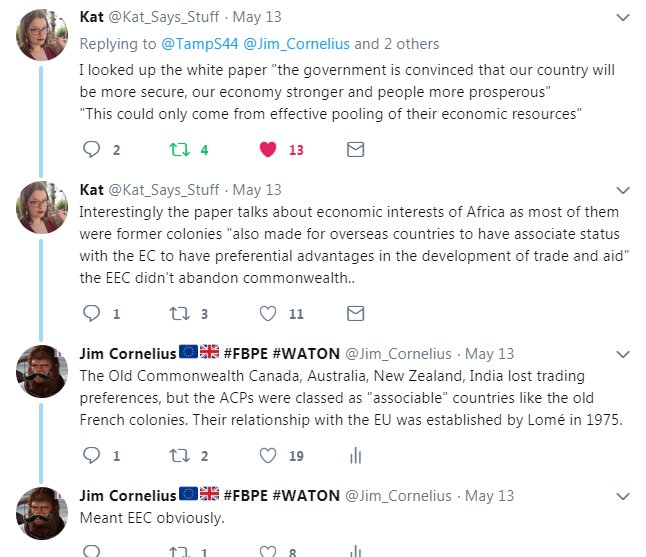
Later that evening I was made aware of Chloe's claim by @TampS44 posting a thread that investigated the source of the 17% food price reduction claim. I was flattered to get a mention. Here's the thread.
When @TampS44 looked into the claim there seemed to be no real source. His investigation led to a a broken link to the defunct exonomistsforbrext.co.uk website and a reference to a 1971 Government paper with a similar number.
This was picked up the next day by @mk1969, editor of The New European, who asked Chloe for a clarification.
Chloe answered sending a link to a "a helpful blog" post written by @jamesprice_tpa of the TaxPayers' Alliance which explained where the figure came from. She also had a little dig at the NE, describing it as a comic.
That's that then?
Not at all!
We are embarked upon one of the biggest changes in this country's history and and it is vital decisions are based-upon accurate information, but what I've found time and time again is that by Leave campaigners facts do not stand up to scrutiny.
This is yet another example!
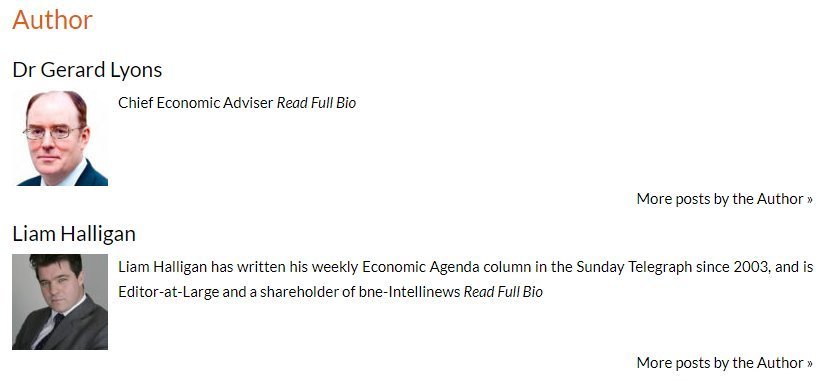
The blog post by @jamesprice_tpa says that Chloe was referencing a book written by Ben Ramanauskas called "Why the Cost of Living is so High" that cited a paper by Halligan & Lyons that calculated that food prices were 17% more expensive due to the Common External Tariff.

By the way, is it worth me pointing out at that if you add 17% to something and then take 17% away you're taking more away than you added?
You only need to take 14.53% away.
100+17%=117
17/117 = 0.14529 = 14.53%
100+17%-14.53% = 100.
I've gone and done it anyway.
Anyway, I don't have access to the book, but the "Clean Brexit" paper by @LiamHalligan and @DrGerardLyons with the calculation in it is available online.
Here's the link: policyexchange.org.uk/publication/cl…
Click "Read Publication" to get the PDF.
Let's look at that calculation.
Ok, on page 10 we get the 17% figure.
It says "Some estimates..."
Hang on, I was sure @jamesprice_tpa said Hannigan & Lyons had calculated this figure?
Well there's a reference to endnote 14 at the end of paragraph. Let's see what that says.
policyexchange.org.uk/wp-content/upl…

The endnote is on page 49. There's a link to economistsforbrexit.co.uk ( which no longer exists) and a reference to a 1971 government paper.
So where's the calculation that Halligan and Lyons are supposed to have made?
There isn't one. Just a dead link, and a ref to 1971.

But hang on. All is not lost. The post by @jamesprice_tpa tells us that the figure is corroborated (so not claimed to be the original source) by Dr Kristian Niemietz.

And if we look at the footnote for this we see that it points to a blogpost for the IEA called "Abolish the CAP, let food prices tumble".
So this is new. Let's go look at that!

The 17% is mentioned in the lede and a bit further on with more context.
It says 17% is the difference between wholesale food prices in Europe and world market prices as a result of the total net effect of CAP.
Hmm, OK... a couple of issues here
iea.org.uk/blog/abolish-t…

Two problems (at least).
1. It's talking about the total effect of the CAP, not just tariffs. The blog itself describes how this is much more than just tariffs.
2. The figure refers to wholesale prices, not retail prices, and as we'll see later, this is very important!

I think it's fair to say that when someone goes on TV and talks about prices falling by 17% most people are going to interpret that as referring to the price they'll be paying in the shops.
If you say it, and know it isn't that at all, then you're trying to con people!
Let's carry on with Kristian's blog. Where does 17% come from?
There's a table comparing prices in the EU-27 (before Croatia's accession) with Australia and New Zealand and world food prices.
Kristian's calculation is based on data from the OECD & the World Bank.
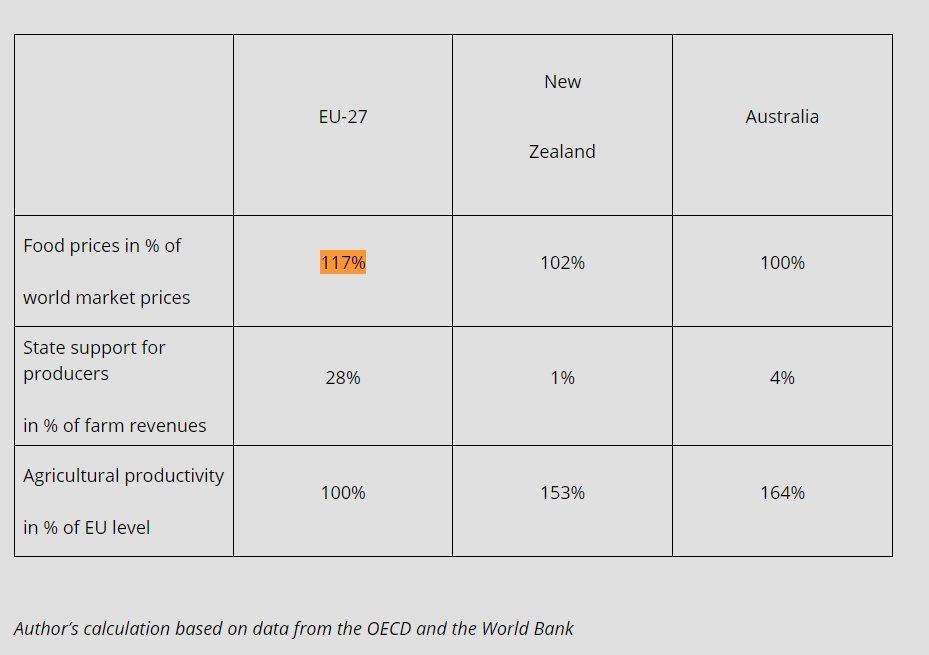
It's not clear from the text where the values come from but thankfully some comments below the article clear this up.
The Alan Matthews posting this comment is @xAlan_Matthews, Emeritus Professor Emeritus of European Agricultural Policy at Trinity College Dublin.
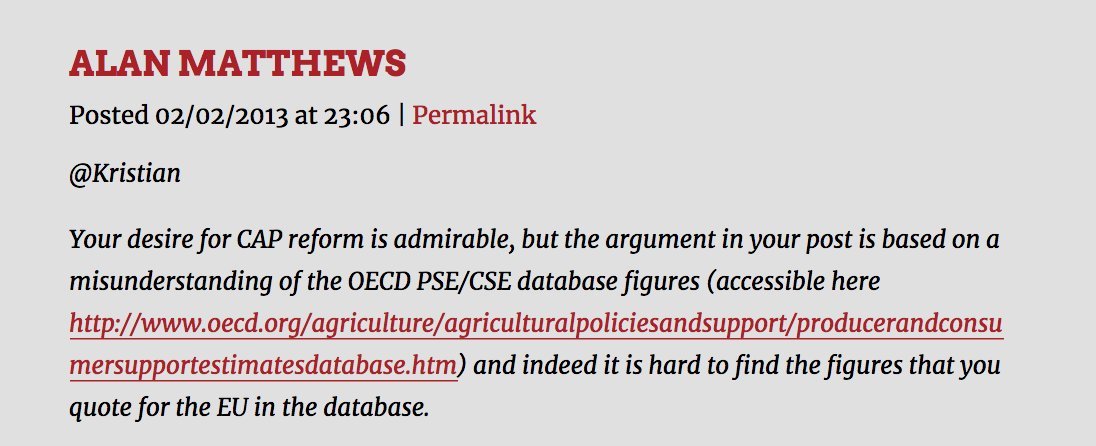
Professor Matthews couldn't see Kristian's numbers in the database of the OECD, but it turned out that Kristian was averaging data between 2000 and 2010 to arrive at the 17% figure.
Here's the source.
stats.oecd.org/viewhtml.aspx?…
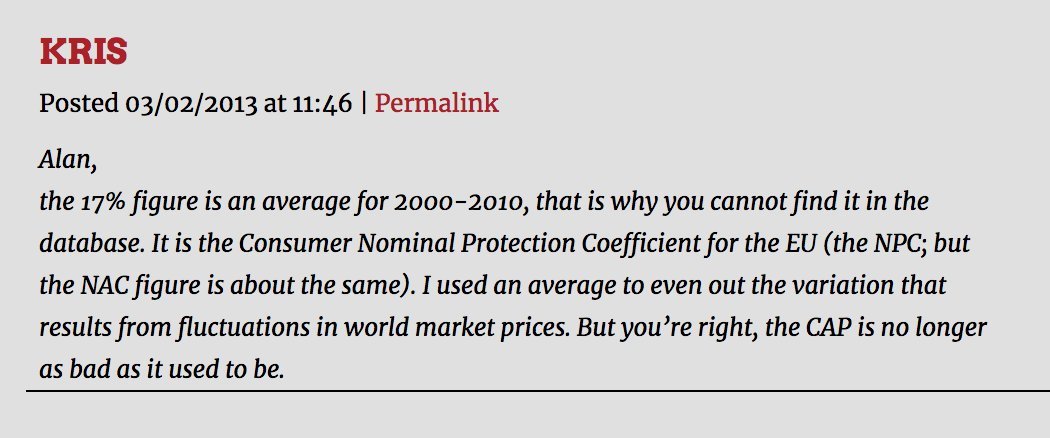
So we've now got to the source of the 17% for Kristian's table and possibly for number that used to appear on the now deleted economistsforbrexit website, but this number is endorsed by TPA anyway.
Let's have a look at the data using the link stats.oecd.org/viewhtml.aspx?…
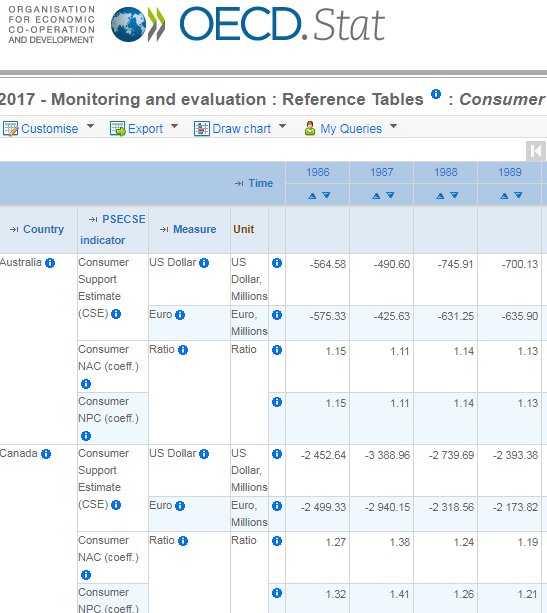
Going onto the OECD website using that link t you can browse the data for 24 countries plus the EU and download it as a spreadsheet if you need to.
So I did that and then filtered it.
We'll use the same stat that Kristian uses, the Consumer Nominal Protection Coefficient
I must point out here that Consumer NPC has nothing to do with retail consumers. It uses the farm-gate price.
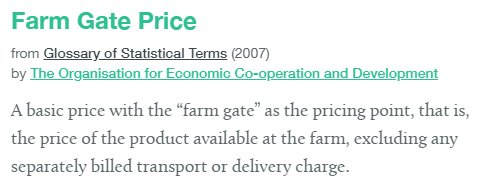
That's the price of produce and commodities at source. The price of wheat, not the price of bread. There are many costs getting this to a customer as food.
Kristian's said in the comments that he used date from 2000-2010 and averaged the C-NPC for the EU, Australia and NZ.
We'll do from 2000-2016 and we'll add in the rest of the G7 and Norway and Switzerland to compare.
The result is a congested unreadable graph. Brilliant!
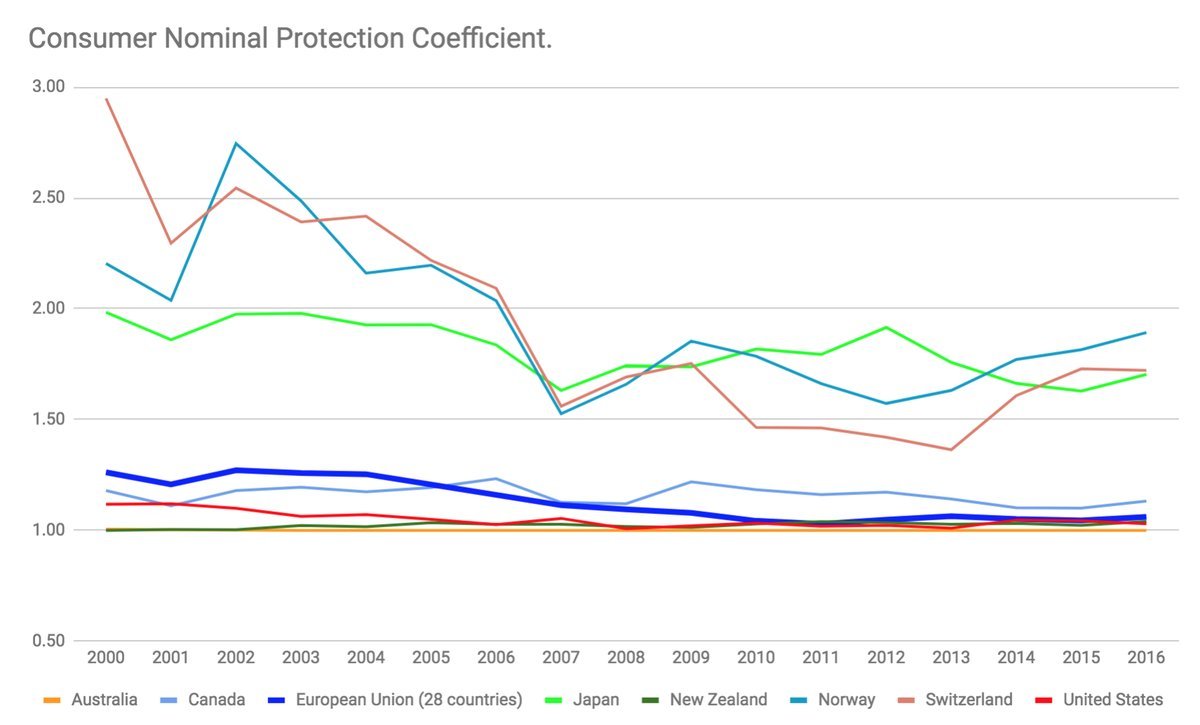
Well not entirely unreadable. Consumer NPC is much greater for Switzerland, Norway and Japan. The rest are hovering around, 0.9-1.2 over the sample period.
Let's remove those three countries to get a cleaner picture of how the EU compared the remainder.
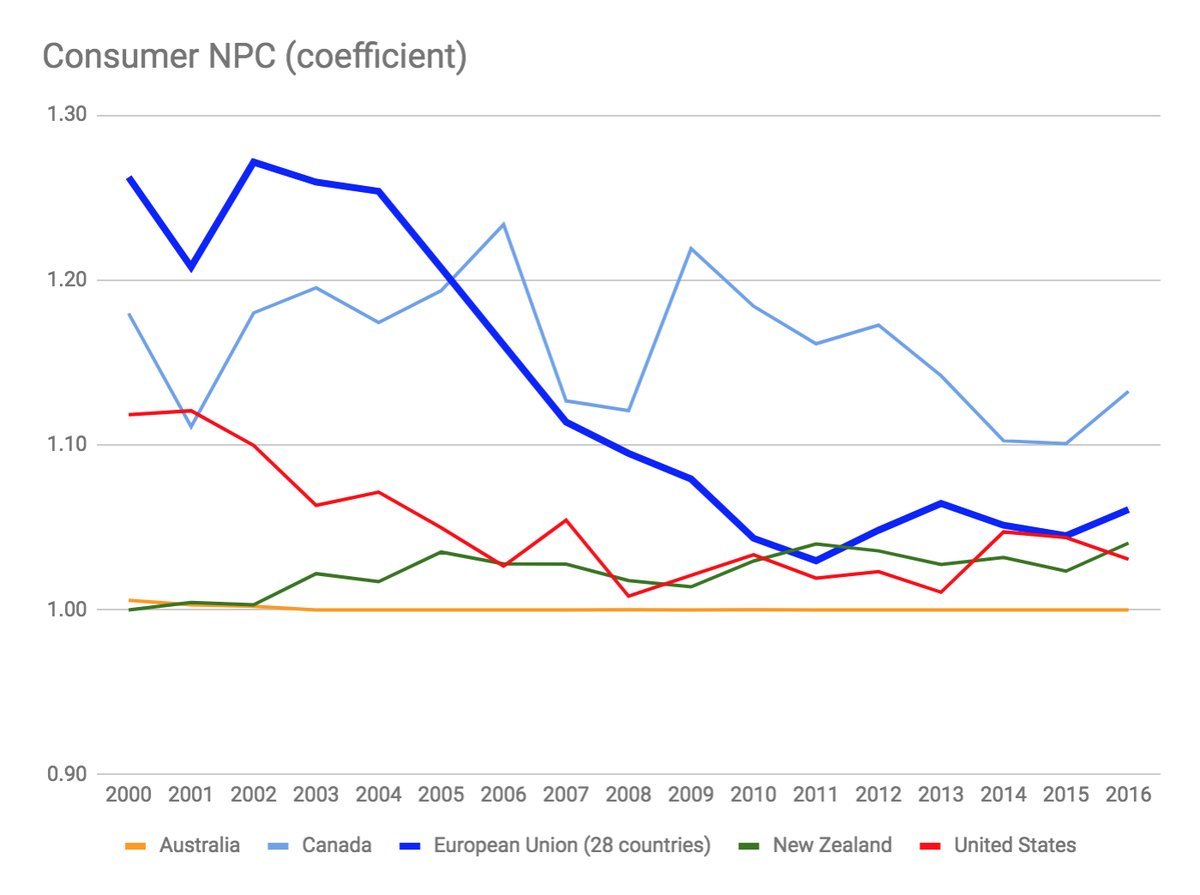
What we see is that the farm-gate prices for the EU have been falling relative to world prices.
Over Kristian's sample period the ratio peaked at 1.27 in 2002 and was lowest lowest at 1.04 in 2010.
Averaged over 2000-2010 the period I get 1.18, but 1.17 for 2001-2010.
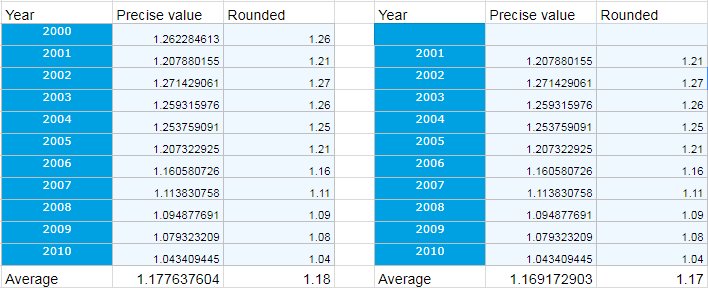
I suspect 2000-2010 is a typo in Kristian's blog. A 10-year span would seem more likely than an 11-year one anyway.
Note that the Consumer NPC was falling over this period. Was falling due to CAP reform over this period maybe?
Since then the numbers look like this.
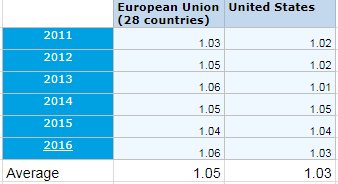
So Kristian's 17% price inflation due to CAP has now become about 5% with up-to date figures!
That's a big difference, and crucially if this is the source of the TPA's claim about price falls, it's a massive own-goal!
What does the author himself have to say about this?
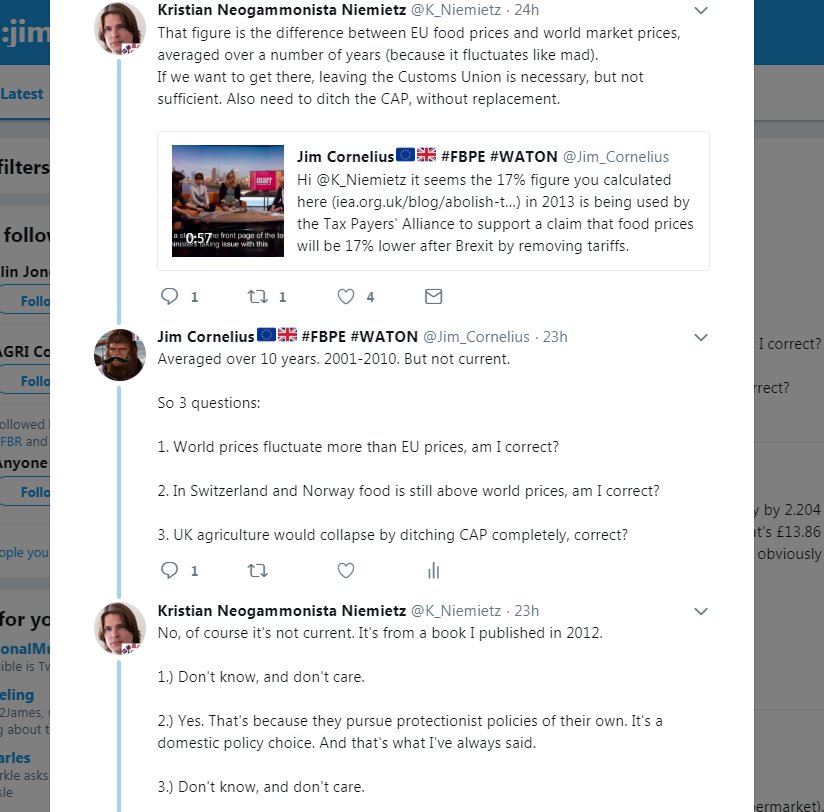
OK the figures were current at the time, but he didn't mention that they were falling over that period. He said it fluctuates, but I think the trend over that 2001-2010 was pretty clear.
Also, remember he's talking about completely abolishing all support for agriculture.
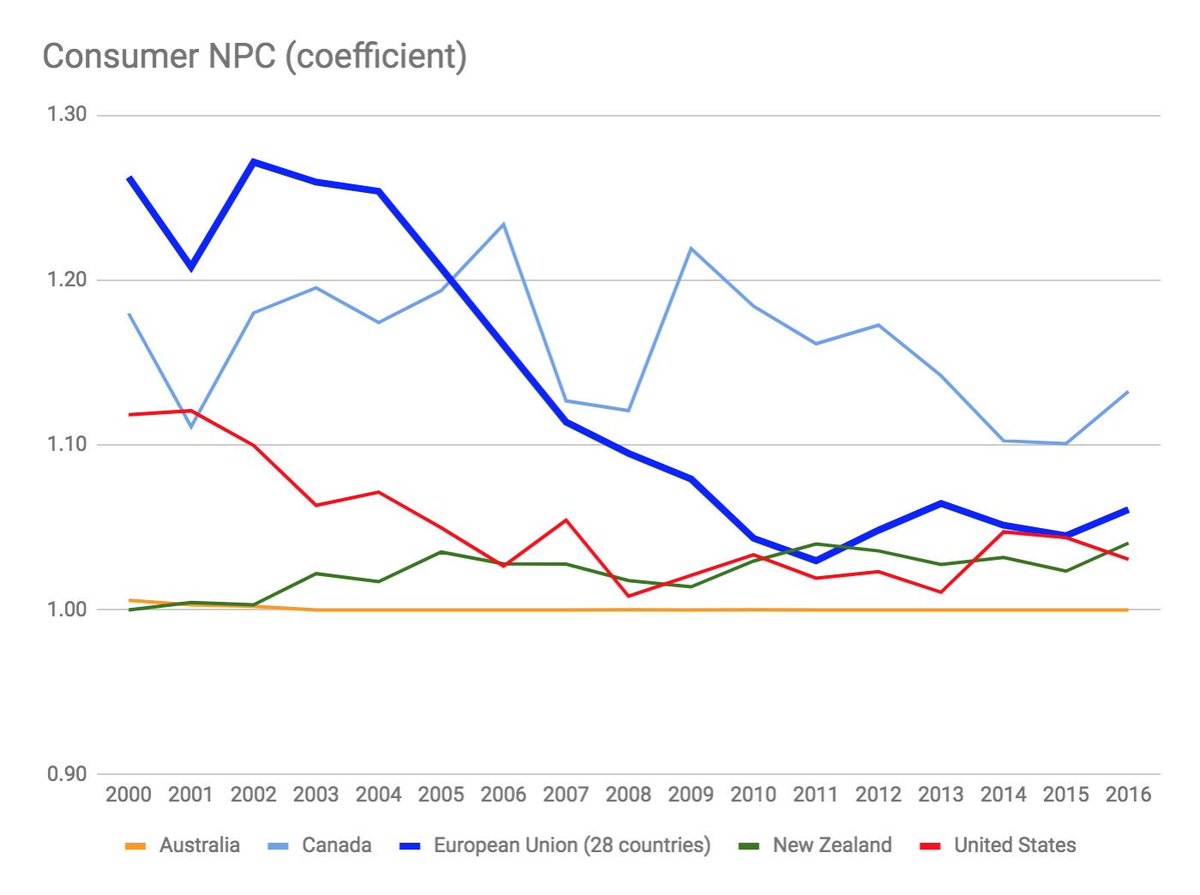
So we're not currently experiencing farm-gate prices 17% above world prices.
So there's no way removing tariff, let alone all protection for the agricultural sector will reduce prices by 17%.
But wait!
I've saved the best for last. This was about farm-gate prices.
We've barely mentioned retail prices yet. How do farm-gate prices relate to the retail price of food?
Well handily Defra published this document in the run-up to the referendum that helps us.
assets.publishing.service.gov.uk/government/upl…

The document is actually looking at the prospect of price rises due to imposing tariffs on food we currently import tariff-free from Europe. But what we're interested in is the coefficient used to go from commodity prices to retail prices found on page 3.
It's 0.27.
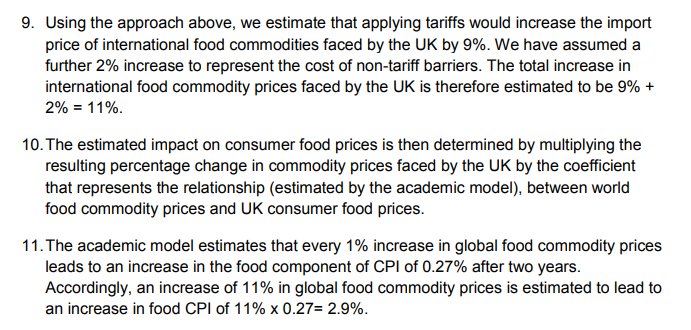
So an increase in farm-gate prices of 17% gives a 17*0.27=4.59% increase in retail food prices.
A more realistic figure of 5% results in a 5*0.27= 1.37% increase.
That's 1.37% Not 17%!
Again: 1.37% Not 17% for abolishing CAP altogether, not just lowering tariffs!
/END
