people often ask me for links where they can learn about observability. i often link to @copyconstruct pieces, the honeycomb ebook, my own stuff. but now i have a new favorite, because these slides from @dotpem's talk at @QConSF .. are.. 💣💥. qconsf.com/system/files/p…
it's a rare set of slides that is funny yet informative, that tells a dense story visually without narration. @dotpem covers the origin story, the business case, metrics/logs/traces, sampling, even an intro to @honeycombio .. all without losing the plot. qconsf.com/system/files/p…
it's so freaking gratifying and awesome to see somebody tell the story better than i do. i get way too down in the weeds sometimes. brb sprucing up my own slides with screenshots of nathan's ...
actually, fuckit, i'm gonna live tweet this bizness. PREPARE YO SELF.
... ready? GO ✨
in the beginning systems were LAMP-shaped and monolithic, and relatively simple. all you needed was your intuition and a few dashboards to reason about them and diagnose failures.
... ready? GO ✨
in the beginning systems were LAMP-shaped and monolithic, and relatively simple. all you needed was your intuition and a few dashboards to reason about them and diagnose failures.


but then VMs happened, and containers happened, and a Cambrian explosion of storage diversity happened, and microservices and serverless and all these far-flung loosely coupled distributed systems happened.
tldr, our tools weren't built to make sense of them. and they don't.
tldr, our tools weren't built to make sense of them. and they don't.


the world has 20-odd years of investment into monitoring tools, log management tools, and monitoring best practices. they've gotten better, faster, but they haven't fundamentally changed much.
monitoring is important, but what we increasingly need now is ... observability.
monitoring is important, but what we increasingly need now is ... observability.

observability is borrowed from the control theory definition, which means how much you can understand about the inner workings of the system by observing the outside of the system. applied to software, this means the ability to inspect live systems with our tools.

where monitoring is about watching for known or predicted failures, observability is about having the raw stuff to flexibly ask *any* question, even ones you never expected to have.
unfortunately, most monitoring tools have been built in ways that prevent you from doing that.
unfortunately, most monitoring tools have been built in ways that prevent you from doing that.
but that's me getting down into the technical weeds again. back to the slides: why should you care about my obscure nitpicking about the predictability of certain failures and storage formats?
because observability translates directly into business value, man.
because observability translates directly into business value, man.


as the stripe report found, most software shops spend 30-40% of their time in technical debt, not building business value. a lot of that debt involves simply trying to understand our own systems.
because understanding complex systems is much harder than building them.
because understanding complex systems is much harder than building them.

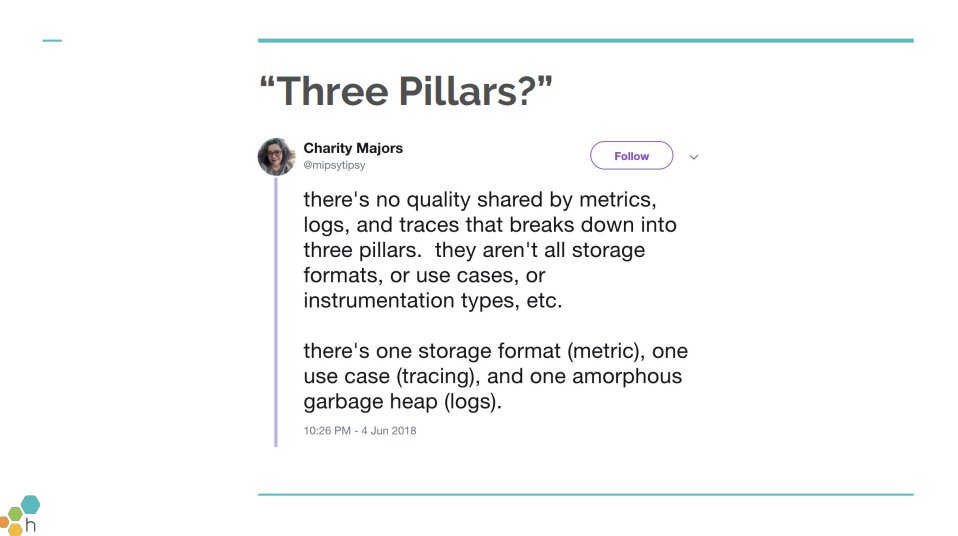
historical note: an older popularized definition of observability was that it consists of three pillars: metrics, traces and logs. this doesn't make any sense, but we'll run with it and score them on how well they do observability.
(see more on this: qconsf.com/system/files/p…)
(see more on this: qconsf.com/system/files/p…)
first: metrics! we give metrics a D. this is why metrics-based monitoring tools can't do observability: because they chop up the event into disconnected dots of data that can *never* be reconstructed into an event for you to ask new questions about.

the connective tissue is gone for good. you only get to ask questions supported by the data as you wrote it out to disk the first time.
not only that, but things like 90th percentile and avg got written out to disk too. you can't compute those percentiles again when you query,
not only that, but things like 90th percentile and avg got written out to disk too. you can't compute those percentiles again when you query,
because you simply don't have access to the raw event data. it's lost for good.
metrics are not useless, they're very cheap and efficient ways of storing aggregate information about the system, counters, etc. but that's not observability. and worst of all...
metrics are not useless, they're very cheap and efficient ways of storing aggregate information about the system, counters, etc. but that's not observability. and worst of all...
open source monitoring tools don't support high cardinality dimensions in their tags. from the prometheus documentation:
this is a problem, because high cardinality dimensions (like req id, instance id, first/last name, shopping cart id, etc) are the most valuable debug data.
this is a problem, because high cardinality dimensions (like req id, instance id, first/last name, shopping cart id, etc) are the most valuable debug data.

logs gets a C from nathan. logs DO offer direct access to the raw data, if you know what you're looking for, structured them properly, captured the right information, and gathered it over the lifecycle of the request in the service, not just spewed it out mid execution.

which is a long list of if's that almost nobody actually achieves with their messy ass logs. hell, even structured logs are still thought of a "stretch goal" for most people.
and then you need to access your data in a way that isn't just fancy grep. (me: screaming)
and then you need to access your data in a way that isn't just fancy grep. (me: screaming)
traces get a B. they are a delightful visualization of requests as they flow through your system, and they are a non-negotiable requirement if you have a bunch of microservices or serverless components. it makes it very easy to find certain types of problems.

traces are a super-powerful component for observability, but they have problems too. it's hard to get incremental value and difficult to roll fully out; can be hard to find a trace for the particular behavior you're interested in; and it's hard to know where to go from there.
spoiler alert: what you really need is aggregated traces, some way of slicing and dicing events to hunt down specific traces, and then flipping back from trace view to event view to look for outliers and aggregate anomalies and critical event context. (honeycomb does this 🙌
what you really want, whether you knew it or not, is these arbitrarily wide structured events, stashed in a distributed elastic columnar store, where every key is an index.
... like honeycomb. 🐝
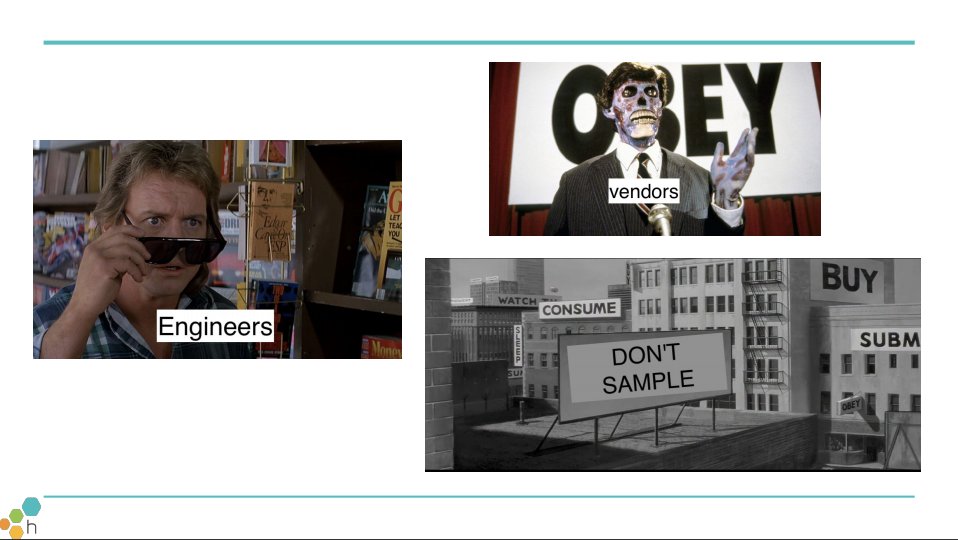
(obligatory vendor disclaimer: think for yourselves! don't be sheep!)
... like honeycomb. 🐝
(obligatory vendor disclaimer: think for yourselves! don't be sheep!)

this is a morality play, people. the health fo the system in aggregate ... doesn't really even matter much. what DOES matter is your user experience.
which is another way of saying what matters is the health of every request, and every way of slicing or grouping requests.
which is another way of saying what matters is the health of every request, and every way of slicing or grouping requests.

every "request" to your site probably spawns dozens or hundreds of system requests and events behind the scenes. you need to be able to break down and identify and inspect each one in exhaustive detail, when things go wrong.
if your tool can't do that, it isn't observability.
if your tool can't do that, it isn't observability.
everyone trashes averages, but p95 and p99 have started having dramatically less signal too, given this proliferation of requests.
MANY of your users, not just 1/100, will hit the 99th percentile of requests. or even the 99.99th percentile. MAX ... actually ... matters.
MANY of your users, not just 1/100, will hit the 99th percentile of requests. or even the 99.99th percentile. MAX ... actually ... matters.
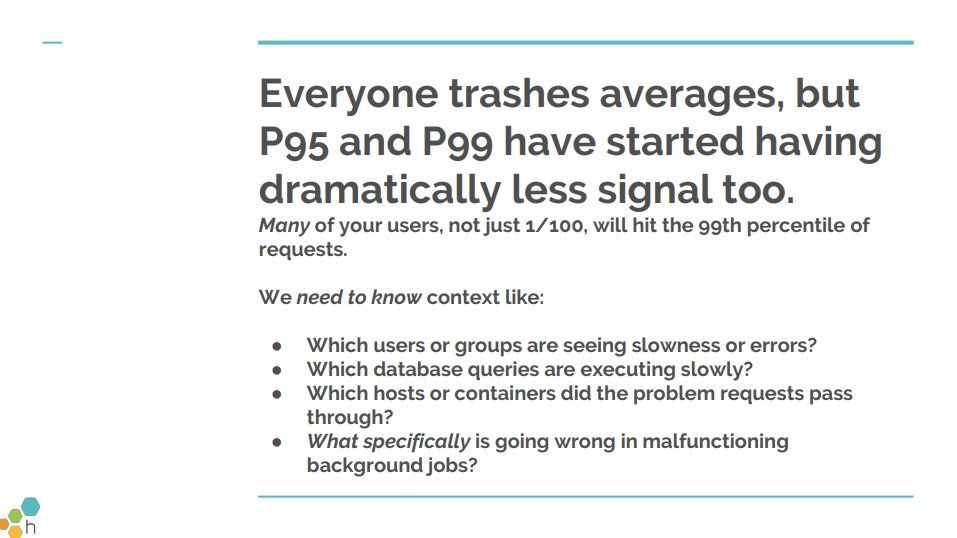
if you think about the questions you need to ask every day, you soon realize there's no way you can ever monitor for all of them.
you are going to *need* the ability to compute things like percentiles on the fly, and flexibly break down by any value of dimension. in real time.
you are going to *need* the ability to compute things like percentiles on the fly, and flexibly break down by any value of dimension. in real time.

okay so this leads straight to the elephant in the room: cost. nobody is going to pay to store all those raw events forever -- your observability can't cost several times as much as your prod systems, nobody will ever pay for that!
correct. fortunately, they don't have to.
correct. fortunately, they don't have to.

this has all happened before, and it will all happen again.
honeycomb grew out of our experiences using scuba at facebook. (whitepaper for scuba: research.fb.com/wp-content/upl…) and FB doesn't pay a multiple of their infra costs for observability, so how does FB solve this problem?
honeycomb grew out of our experiences using scuba at facebook. (whitepaper for scuba: research.fb.com/wp-content/upl…) and FB doesn't pay a multiple of their infra costs for observability, so how does FB solve this problem?
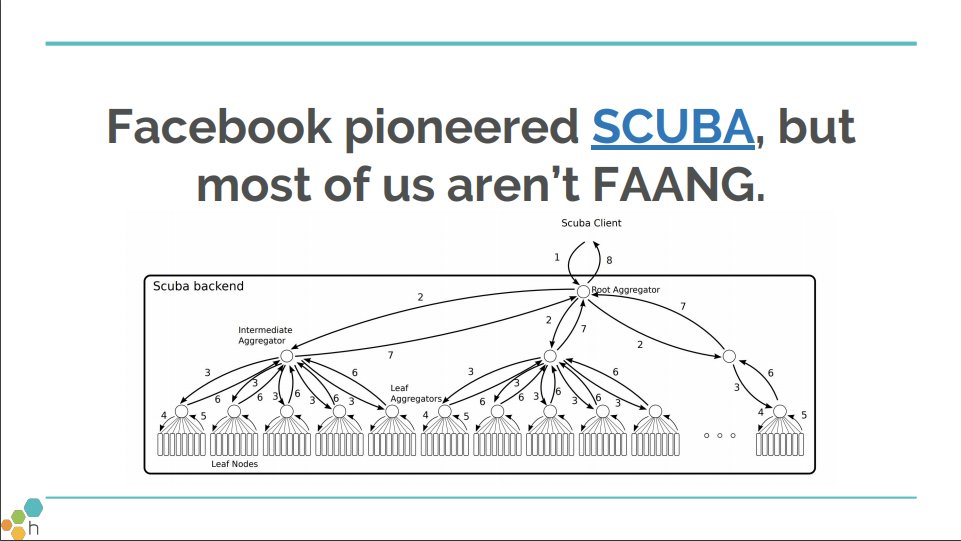
simple: they sample. despite what all the log vendors have been selling you for years, you do not need nor want to store every single record of an event that ever entered your system, especially not multiple times.

the sample rate is a k/v pair attribute for every event. if the sample rate is 4, then each event stands for 4 events. we do the math in the UI and tell you what the sample rate was, but draw the graphs using the correct multiple.


BUT WHAT ABOUT THE HEALTH OF EVERY REQUEST?!?
1. Dude, statistics have your back.
2. any problem worth worrying about will happen multiple times
3. sampling doesn't have to be blunt, it can be extremely smart
4. you may want everything for a short time, then sample out over time
1. Dude, statistics have your back.
2. any problem worth worrying about will happen multiple times
3. sampling doesn't have to be blunt, it can be extremely smart
4. you may want everything for a short time, then sample out over time


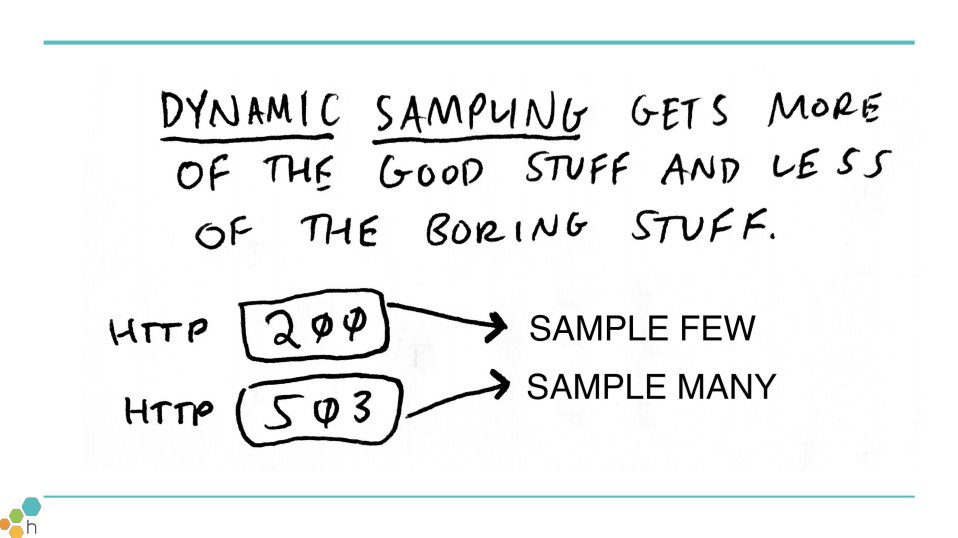
dynamic sampling is a technique you can use to get more samples of the good stuff, and fewer of the boring stuff. honestly, the overwhelming majority of the requests you have are incredibly boring.
requests to the root domain that return 200? bo-ring. errors? not boring.
requests to the root domain that return 200? bo-ring. errors? not boring.


even whole traces can be sampled as they hop around your system, by propagating a sampling decision made at the root... or even by using deterministic sampling, e.g. a consistent hash of the request id.
also: canopy is cool.
also: canopy is cool.


in conclusion:
1 - observability lets you ask and answer questions about your system, even unknown-unknowns. this is increasingly non-negotiable for people writing or running distributed systems.
2 - sampling is a powerful technique to make observability affordable and scalable
1 - observability lets you ask and answer questions about your system, even unknown-unknowns. this is increasingly non-negotiable for people writing or running distributed systems.
2 - sampling is a powerful technique to make observability affordable and scalable

3 - observability will be a key differentiator in succcessful businesses in the coming years. software is eating the world, and complexity is skyrocketing.
4 - grasping observability will separate the engineers who can build and maintain complex systems from those who can't
4 - grasping observability will separate the engineers who can build and maintain complex systems from those who can't
the end. thanks again @dotpem for such a delightful talk and set of slides. once again, the slides can be found at qconsf.com/system/files/p…, and probably the talk is on that site too.
cheers!🐝
cheers!🐝