So the #BrexitBorderlands project set out to chronicle the Troubles in a new way - interactive data visualisaiton.
Thread on data here:
The tool is weepeople.css by @ProPublica and the data is from Post-Mortem, a database of deaths by Michael McKeown, hosted by @UlsterCAIN.
Read 'The Irish Times - Keeping The Peace' here:
irishtimes.com/news/world/bre…
Click on a figure to find out the individual's name and how, where and when they died.
irishtimes.com/news/world/bre…
#BrexitBorderlands
No part of Northern Ireland was left untouched.
D3 map developed from previous code with @cboutaud, data from @START_UMD.
Read the full story here:
irishtimes.com/news/world/bre…
Every fatal terror attack across Europe since 1970 - the size of each red circle represents the scale of loss.
Hover on a circle (desktop) to see the details of each attack.
Made with D3 & data from @START_UMD
There are 120 external land border crossings along the most eastern border of Europe.
In Northern Ireland there are currently 208.
Compare both here: irishtimes.com/news/world/bre…
How does #Brexit impact this?
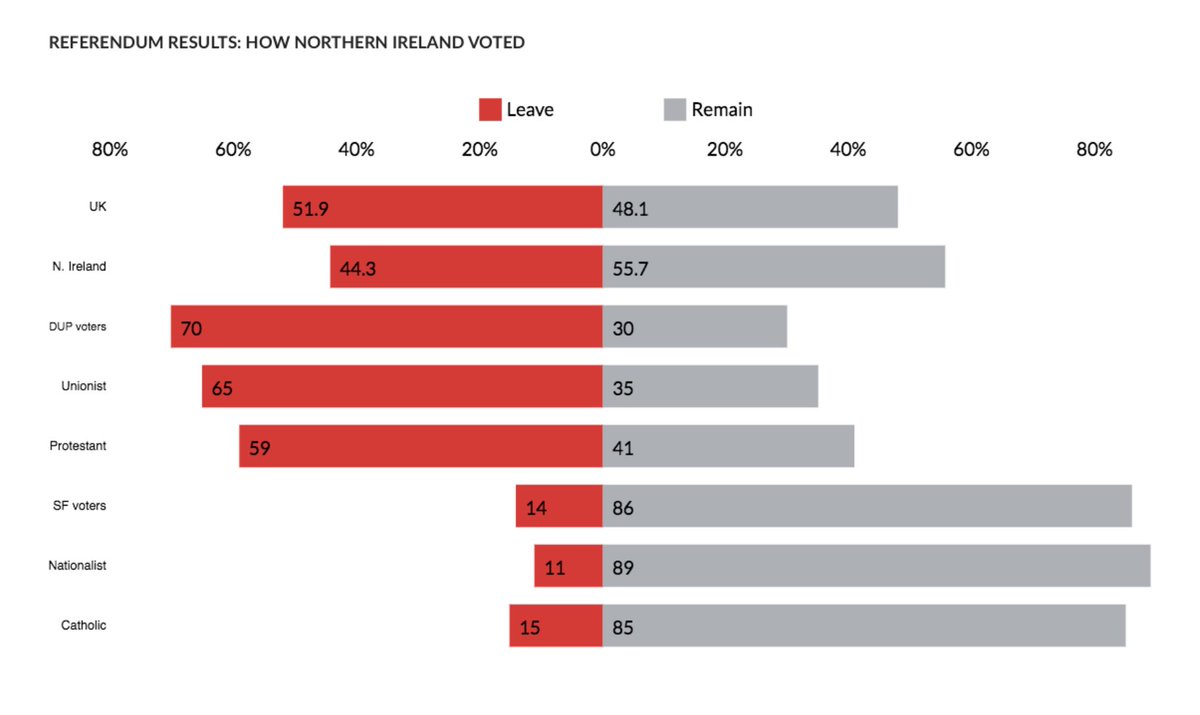
While majority of NI voted Remain, a breakdown of voter demographics shows Brexit is a worrying new division.

irishtimes.com/news/world/bre…
Stats aside, I'll share standout local stories from the border in a dif thread tomorrow.
And if you like data stories like this, sign up to my newsletter - a monthly roundup of the best out there: bit.ly/2HdGcYI
It helps make sure they can invest in more innovative storytelling, expand their reach to border areas and make sure the full story of Brexit's impact on the Border is told!
irishtimes.com/subscribe/ie?g…


