,
20 tweets,
16 min read
Read on Twitter
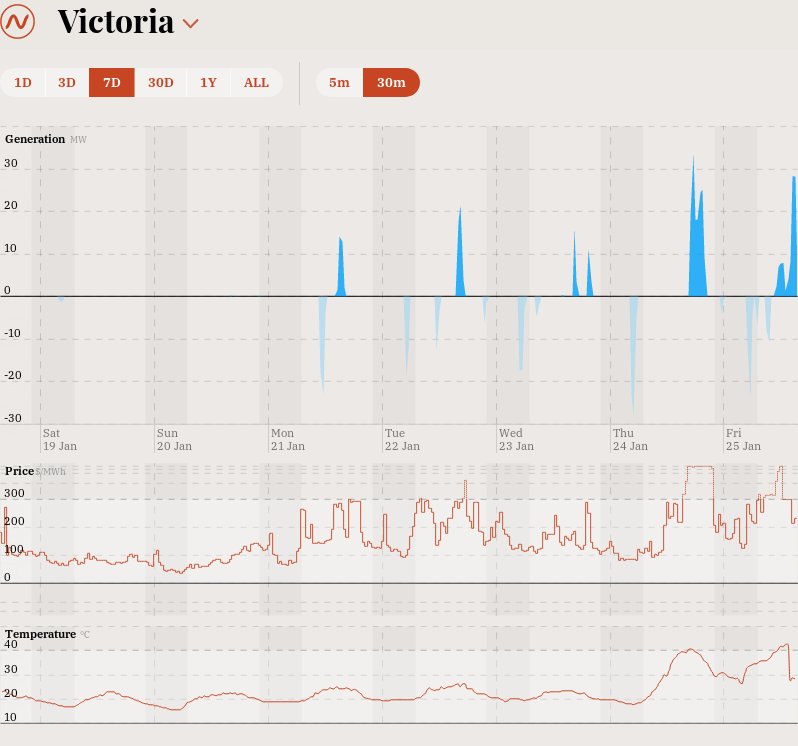
@GreenpeaceAP So let's look at what Victoria's electricity demand profile was like for the last week, shall we? 1/x 
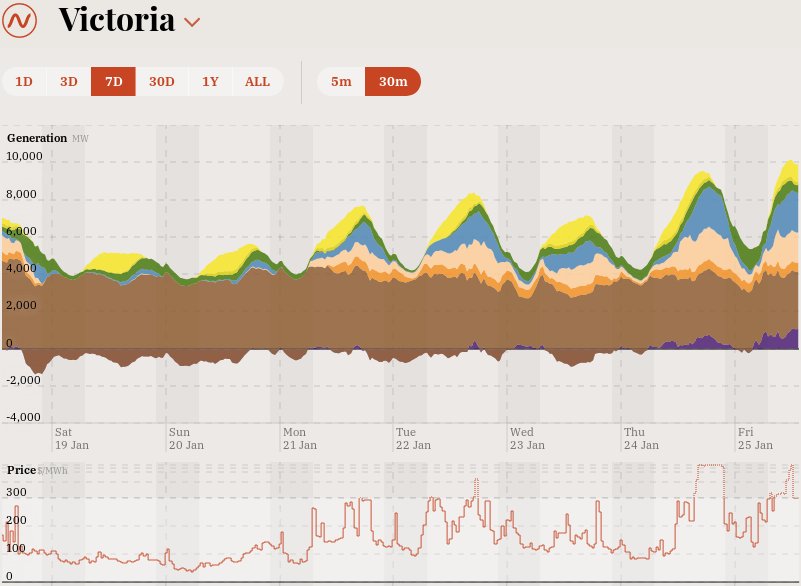
@GreenpeaceAP And as a bonus, I'll include the battery storage data in isolation for Victoria as it stood for this week. opennem.org.au/#/regions/vic
Sit tight, you're about to meet #whtr. 2/x
Sit tight, you're about to meet #whtr. 2/x
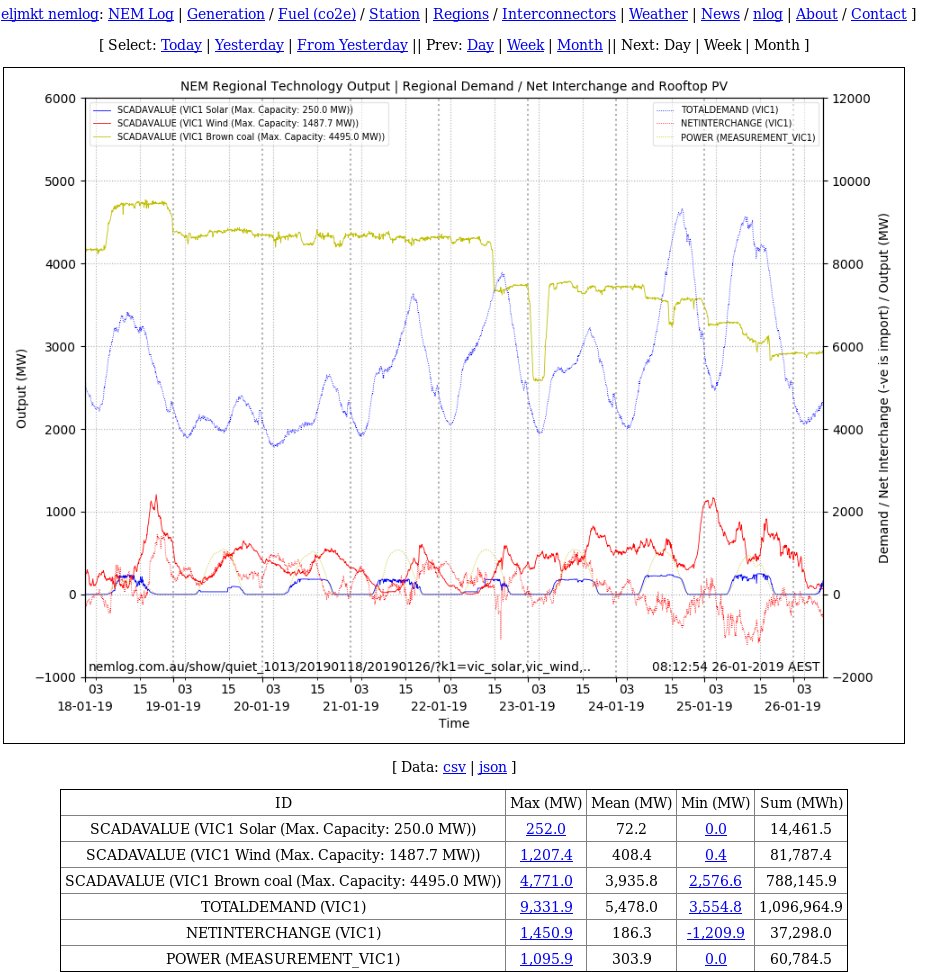
@GreenpeaceAP Also, another source of data that's rather nice & profoundly instructive: nemlog.com.au/show/quiet_101… 3/x
@GreenpeaceAP But meanwhile, while I get this ready for you, something to ponder (if you are really serious about things like dealing with climate change).
I'll be back. 4/x
I'll be back. 4/x
@GreenpeaceAP Now I don't want you to worry… I haven't forgotten about you 😼
Here's a little preview. #whtr 6/x
Here's a little preview. #whtr 6/x

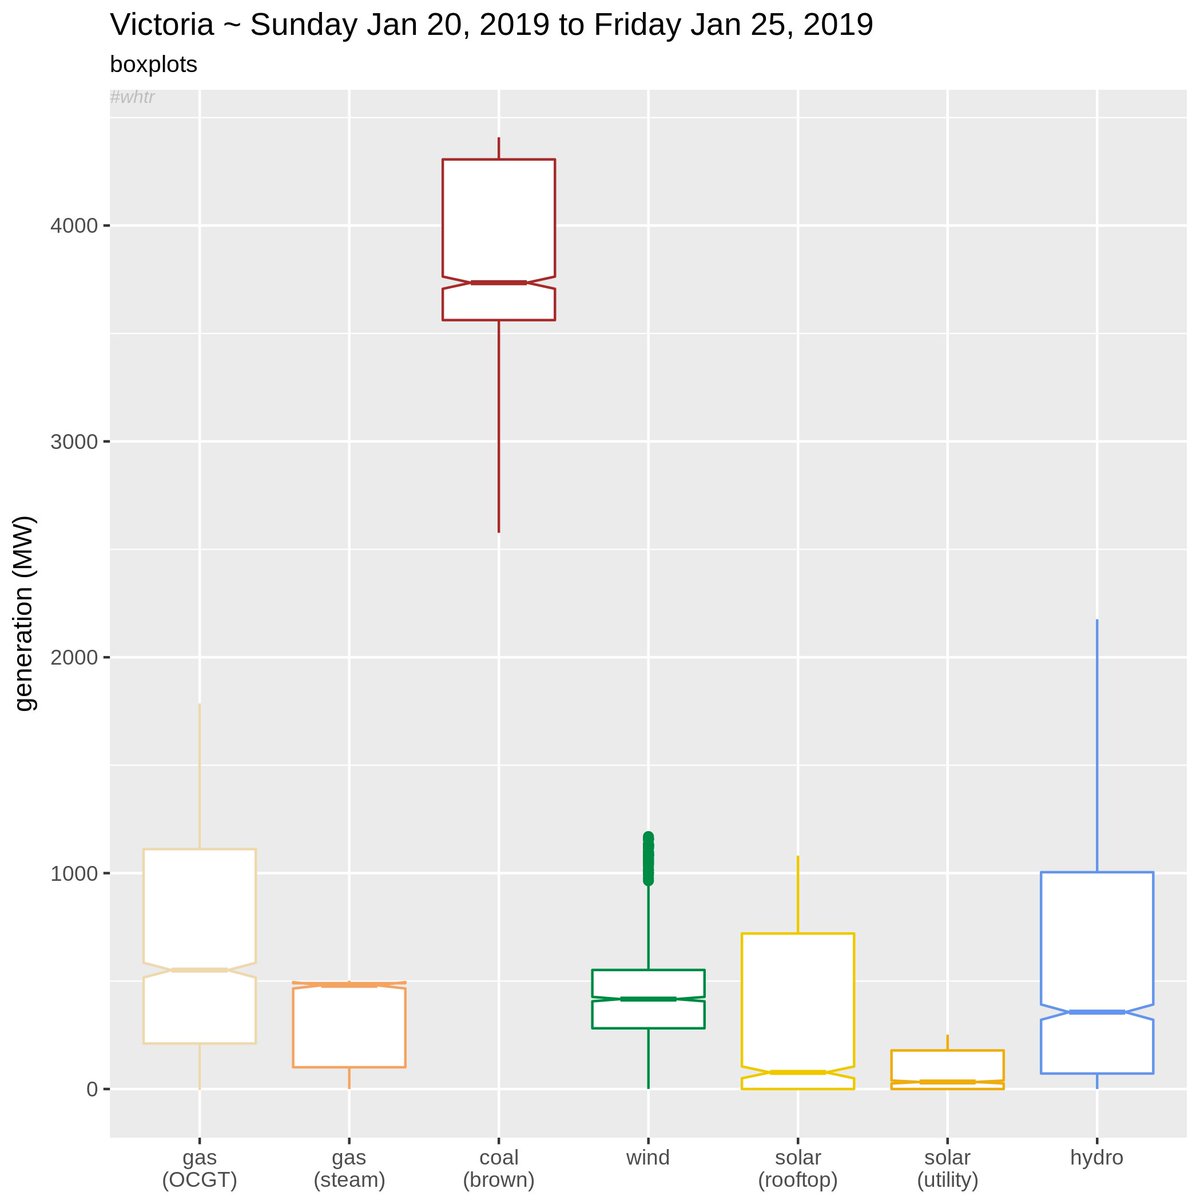
@GreenpeaceAP So let's do this!
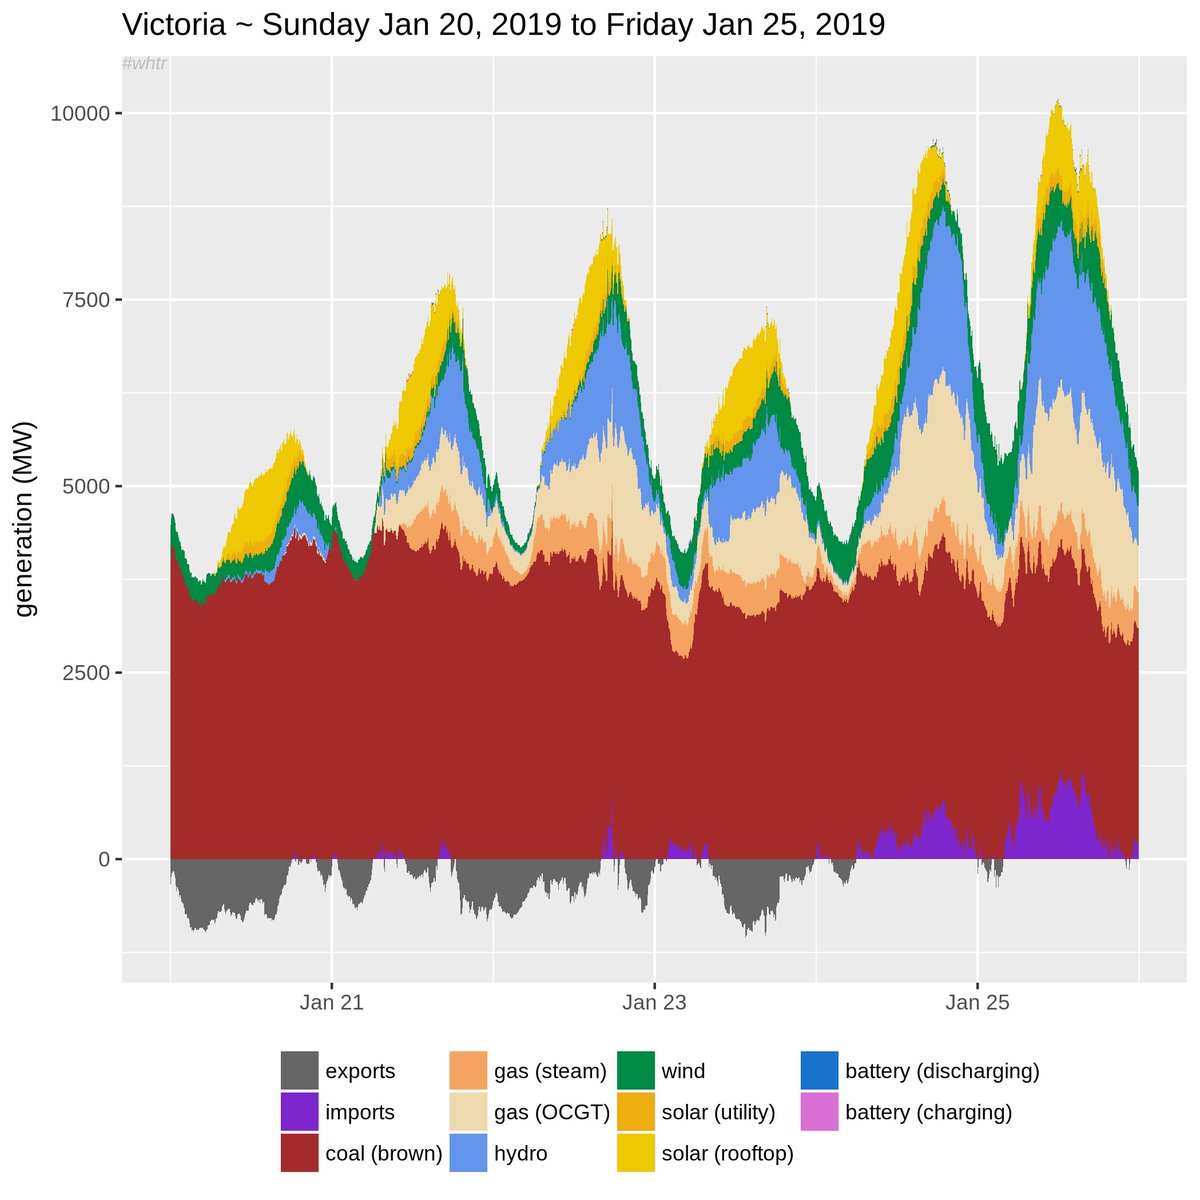
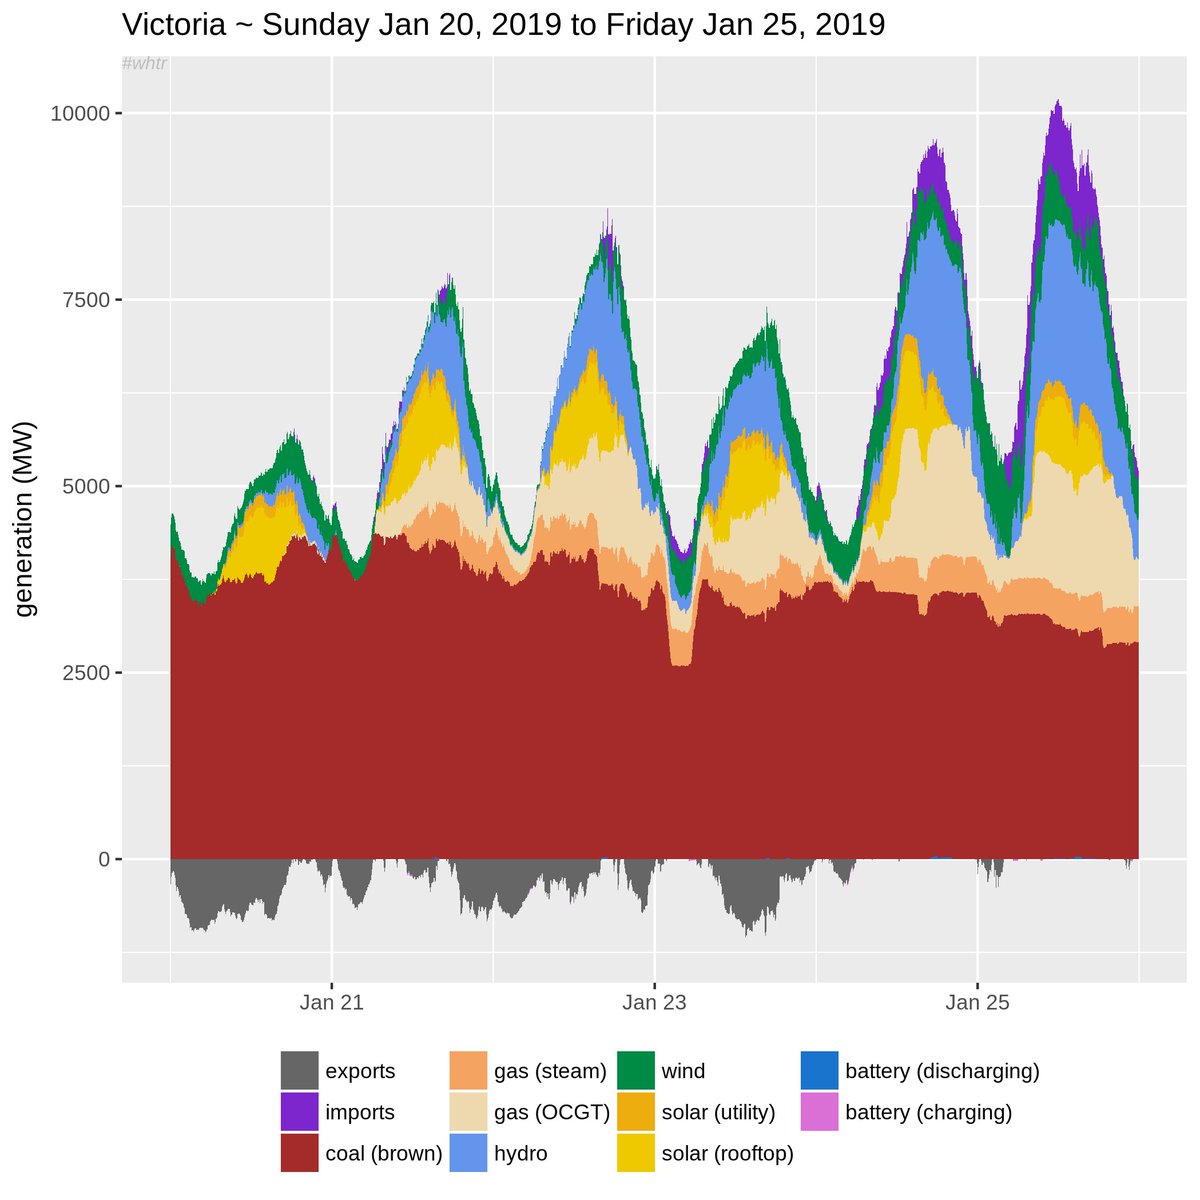
First the profile of demand & how it was supplied for Fateful Friday & the week leading up to it.
Also the same data, just stacked differently so that the "flex‑base" nature of some energy types is clearer.
And the notable boxplot data. #whtr 7/x
First the profile of demand & how it was supplied for Fateful Friday & the week leading up to it.
Also the same data, just stacked differently so that the "flex‑base" nature of some energy types is clearer.
And the notable boxplot data. #whtr 7/x
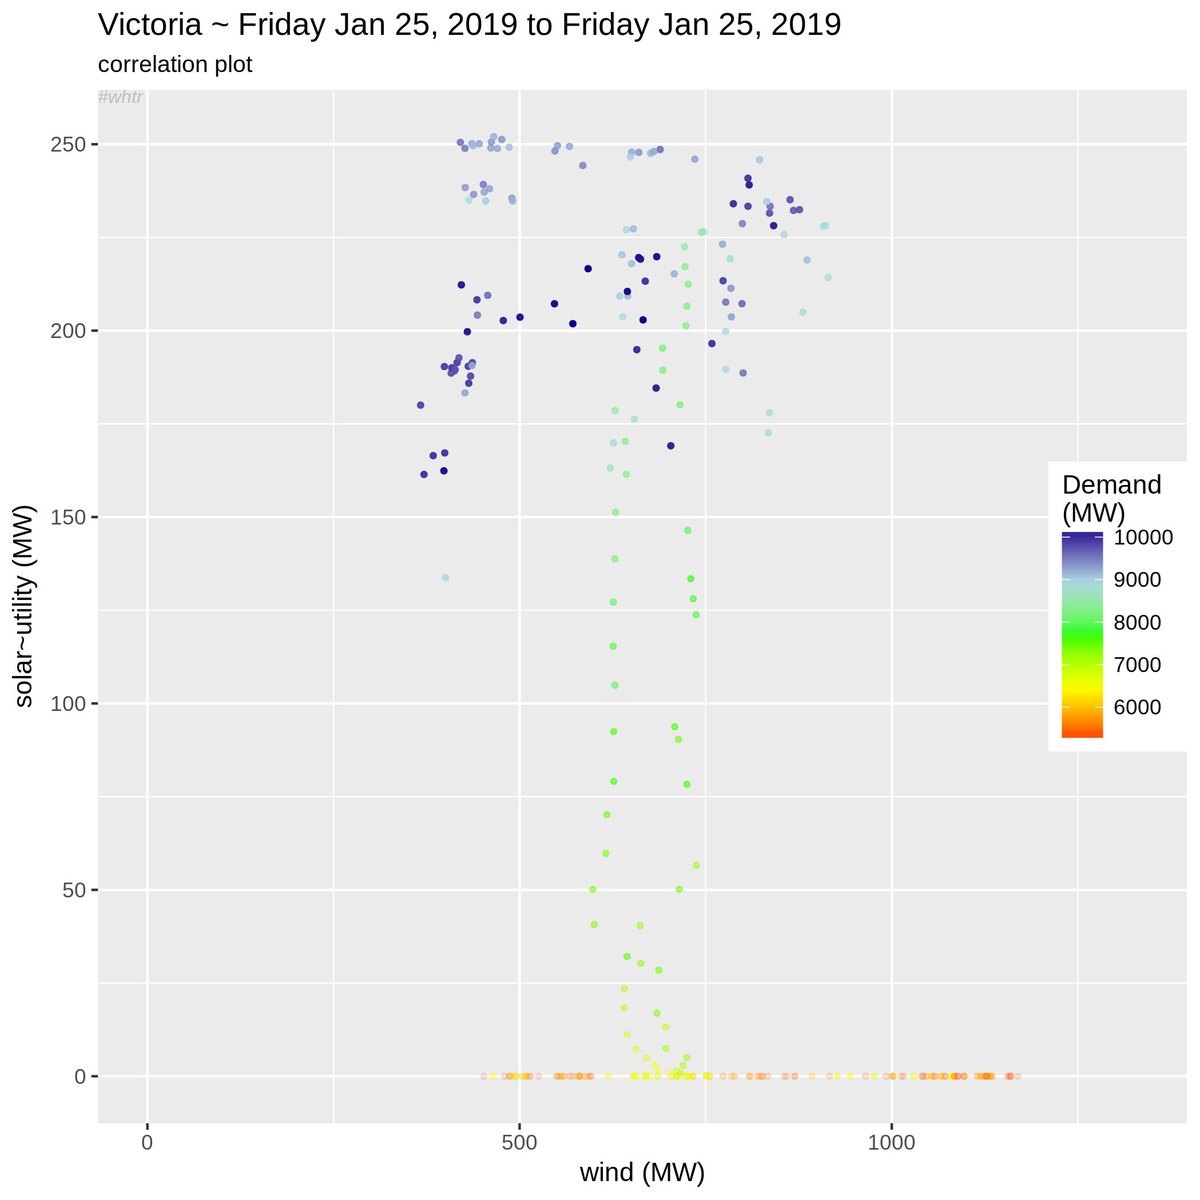
@GreenpeaceAP Now for the cognoscenti I'm including a correlation of wind to both utility & rooftop solar, with demand at the time colour coded. I do this for the 6 days of data, as well as just Friday itself.
"Better than a poke in the eye with a sharp stick" is how to describe this. 8/x
"Better than a poke in the eye with a sharp stick" is how to describe this. 8/x
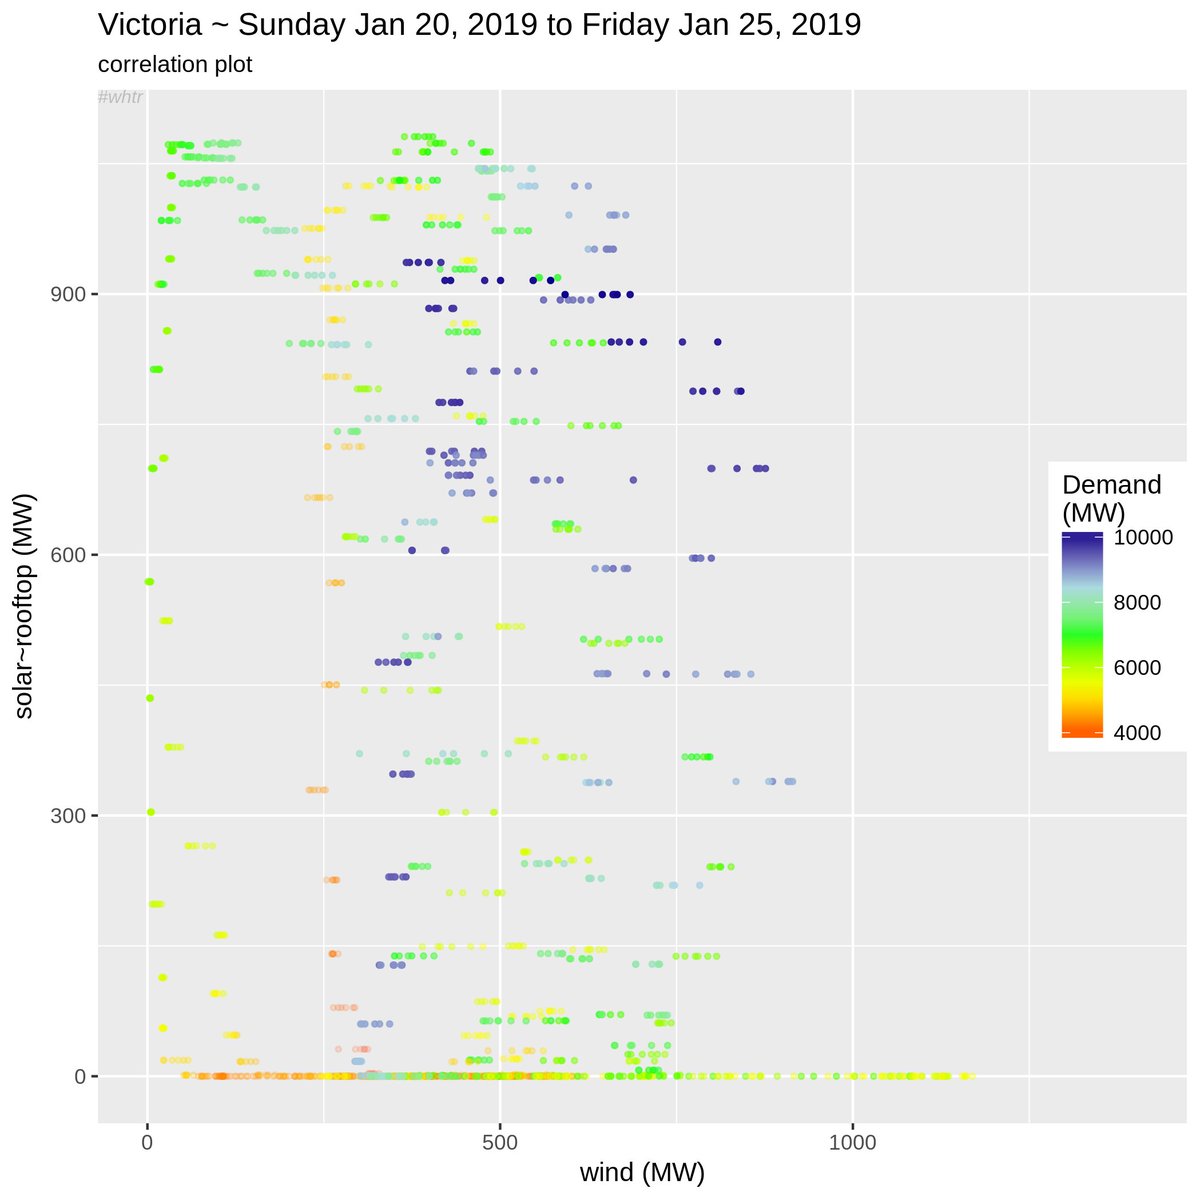
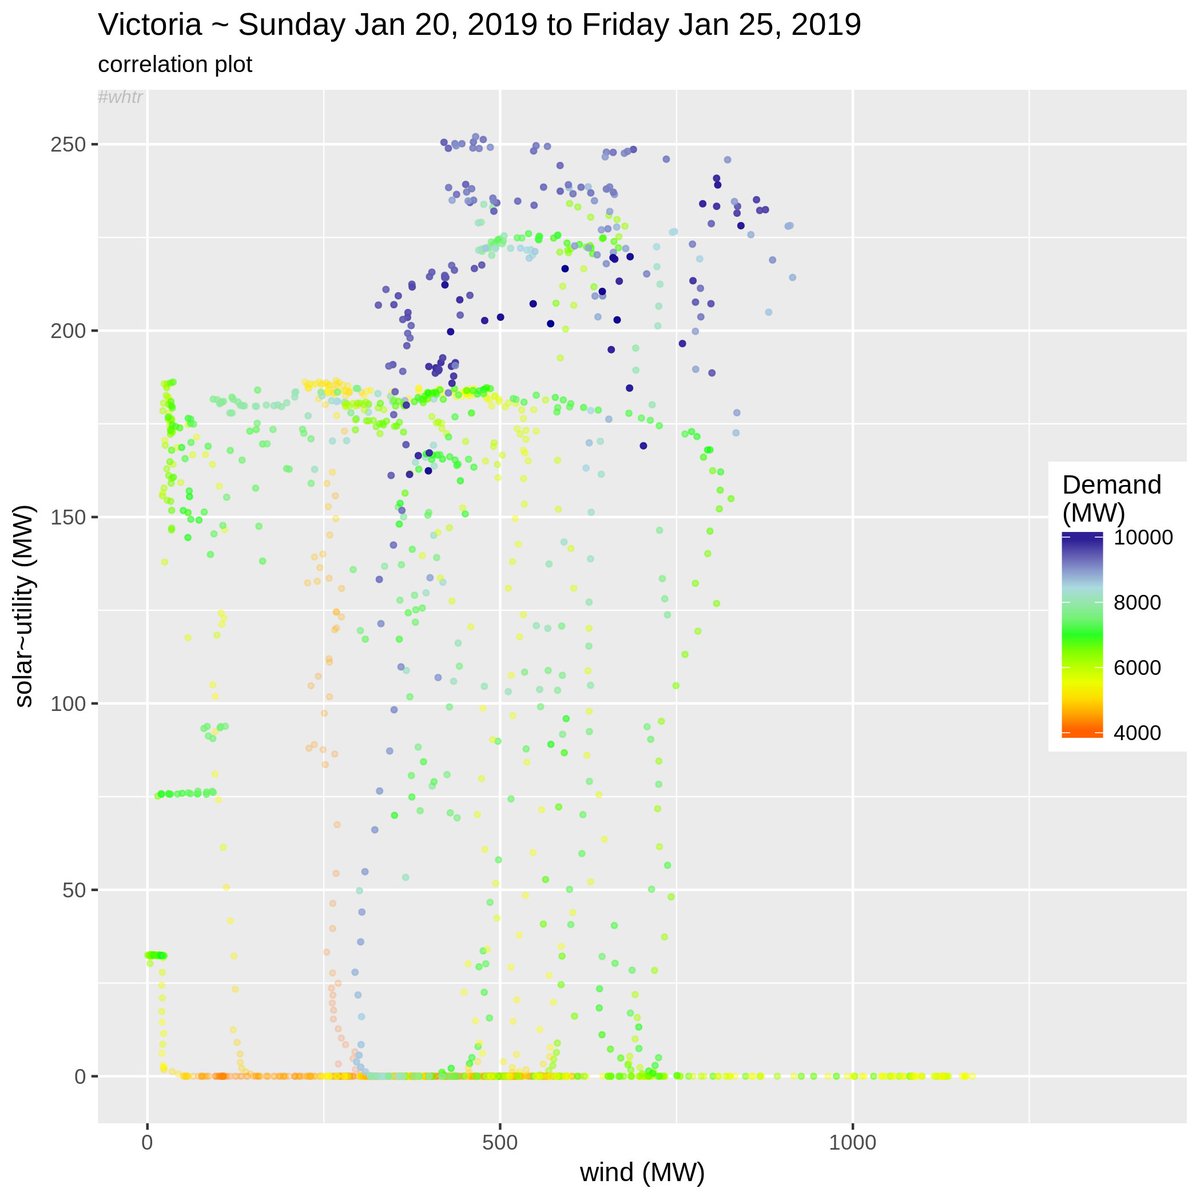
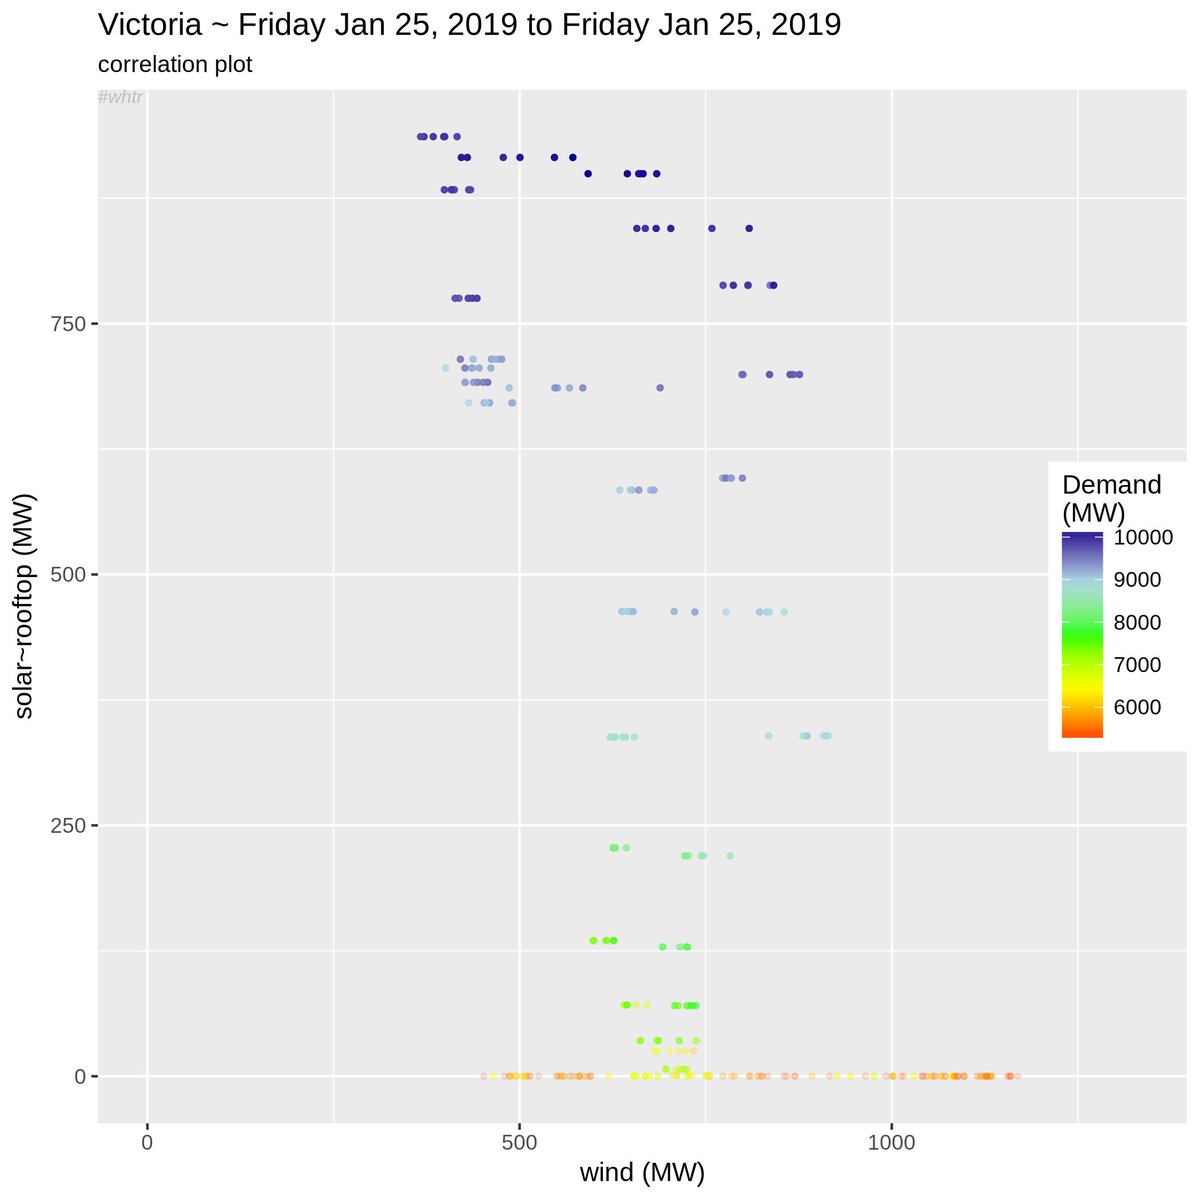
@GreenpeaceAP That's a technical term btw.
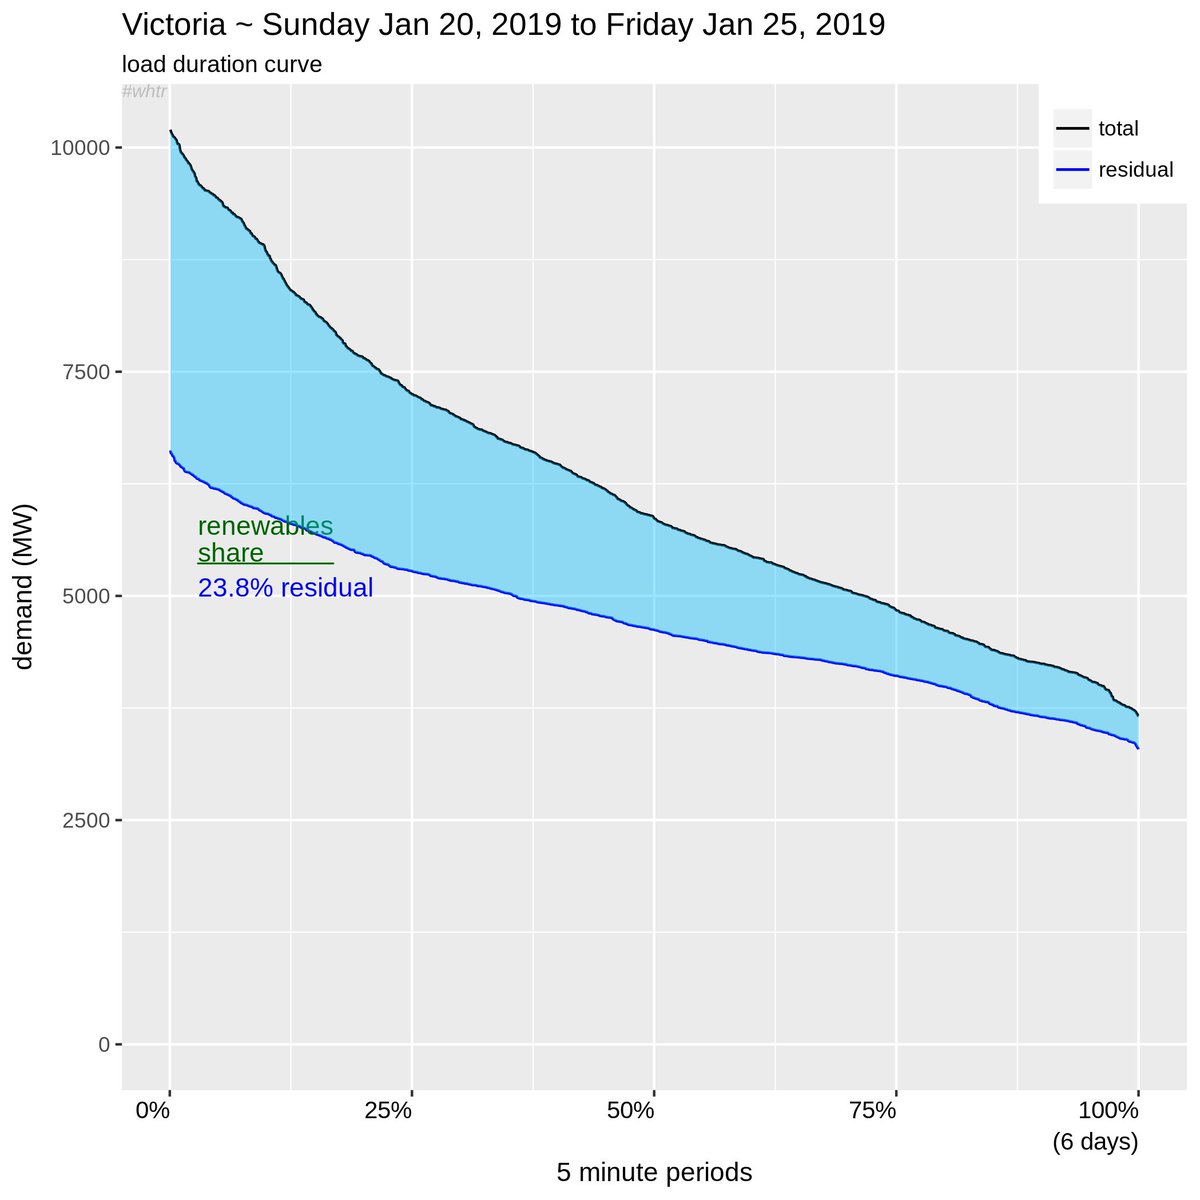
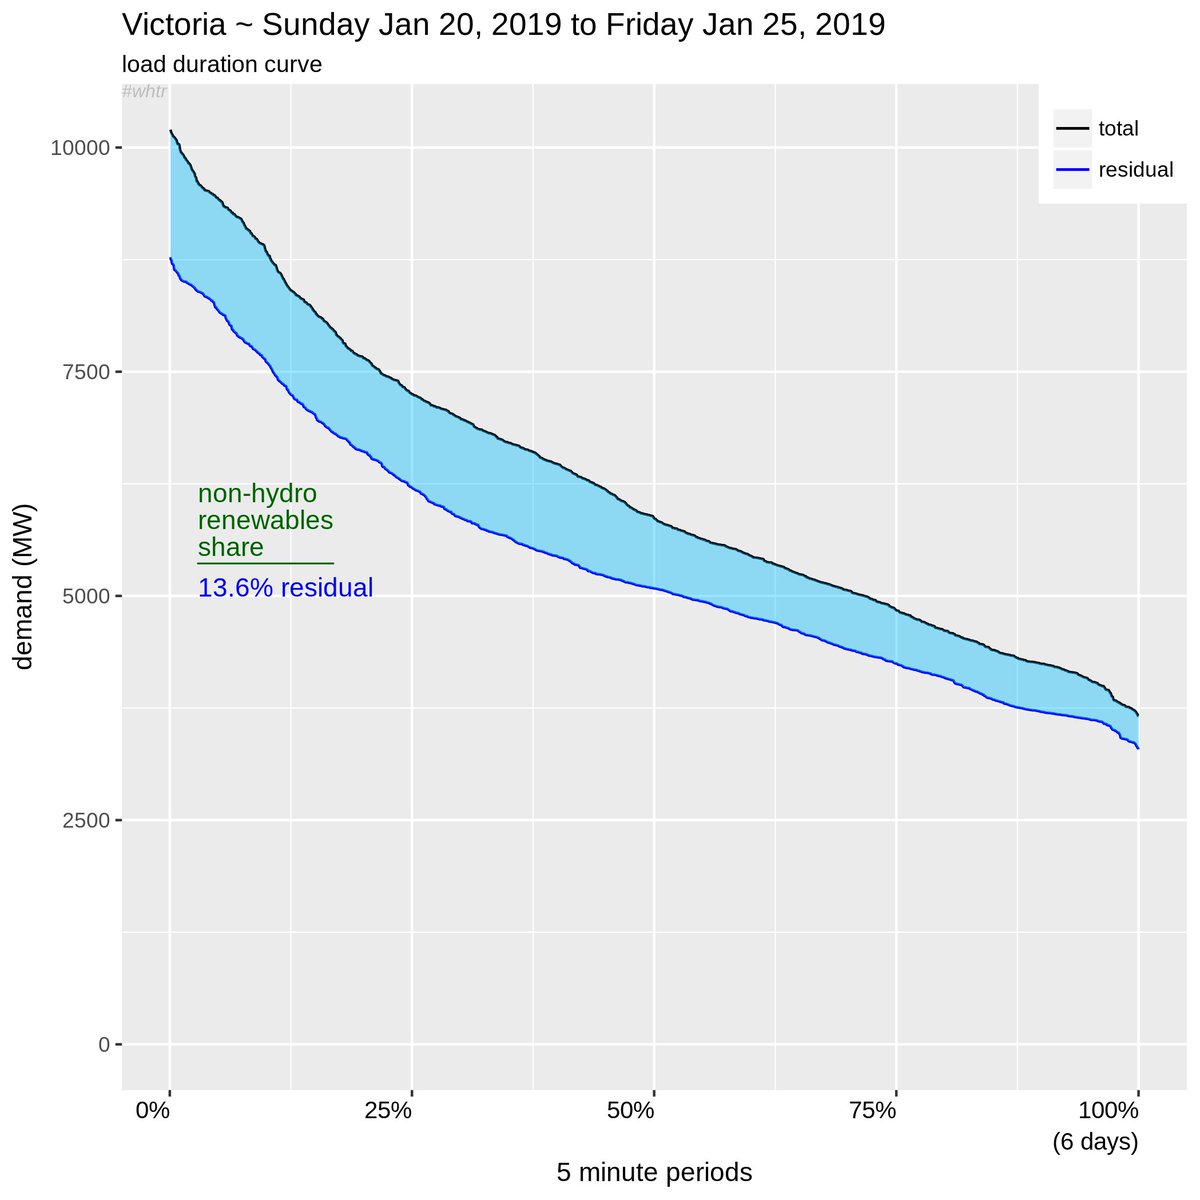
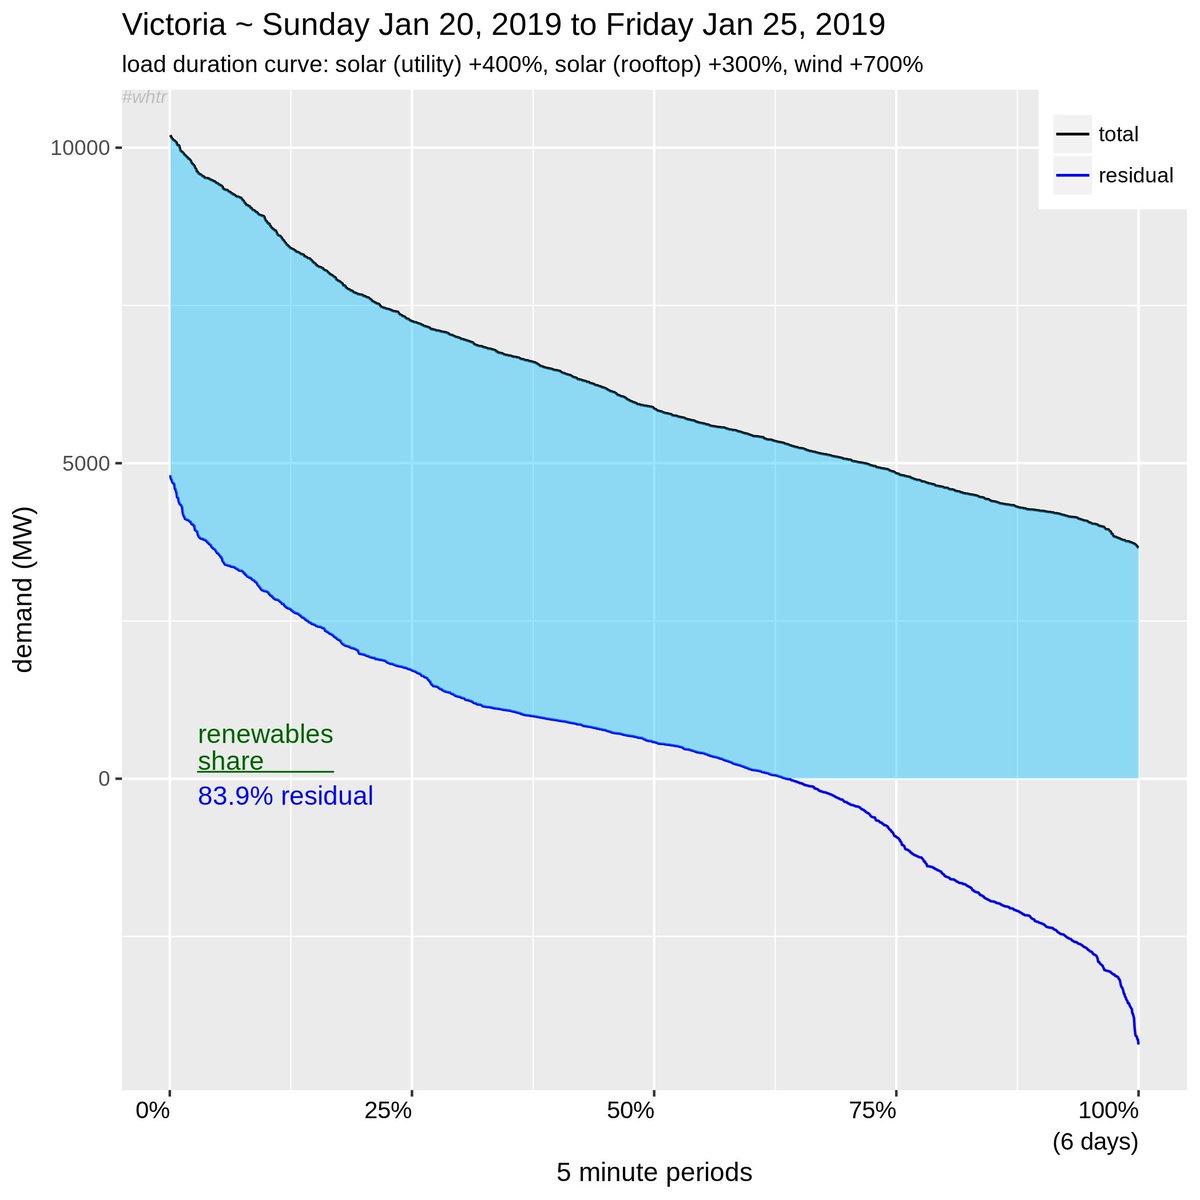
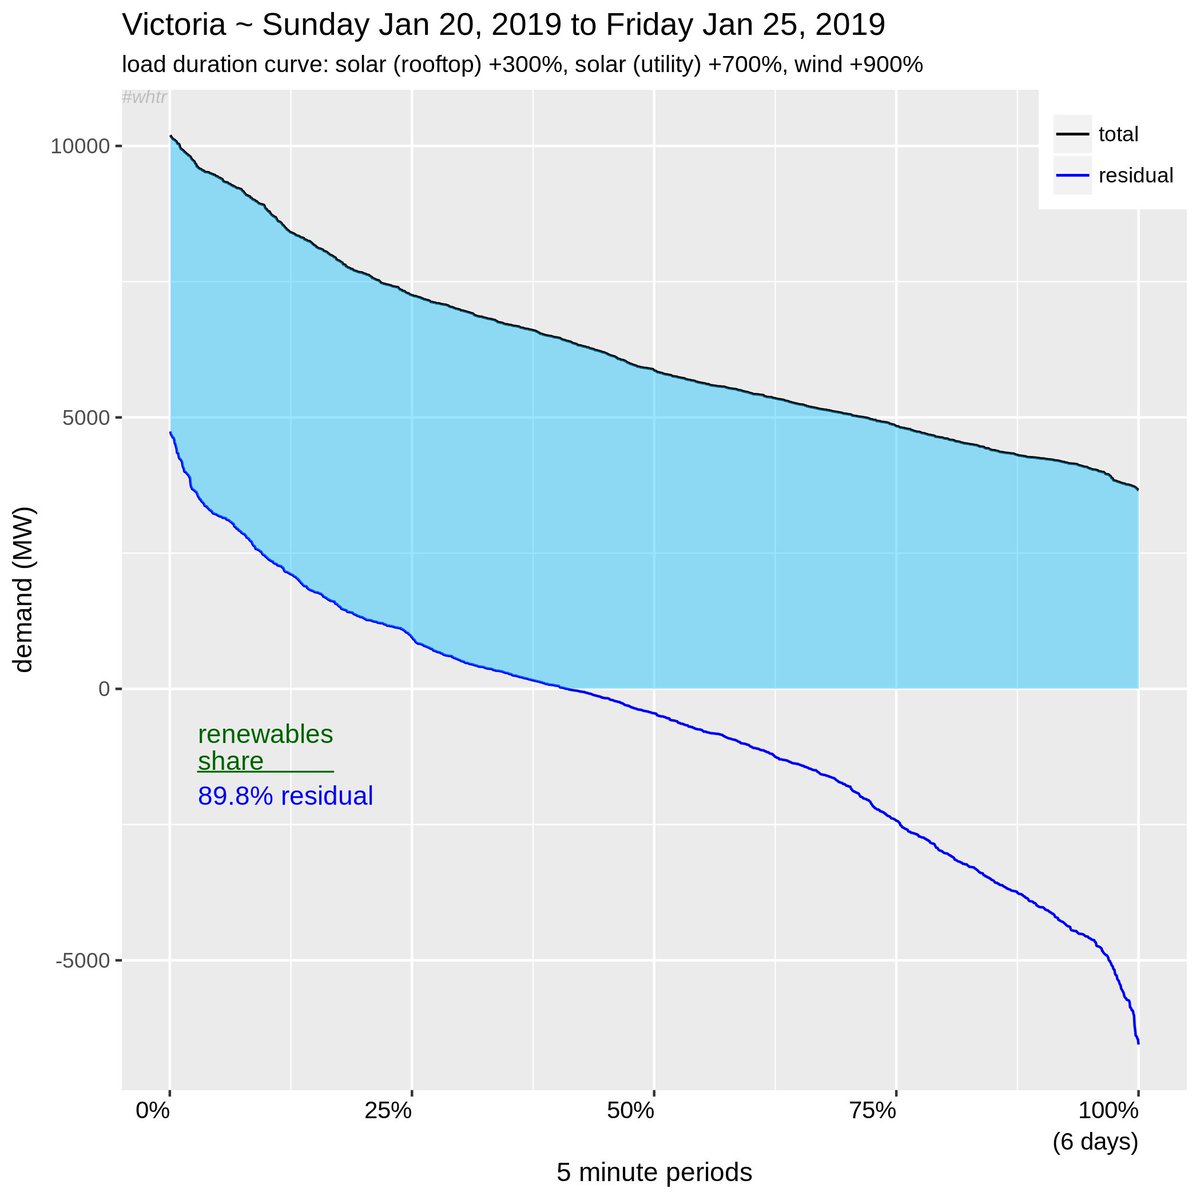
Now some load duration curves, both with & without the impact of hydro. Don't know what this diagram is? Try here: google.com/search?client=…
Note that by plotting a curve sans renewables, we get a clear view of the % share (shaded area). 9/x
Now some load duration curves, both with & without the impact of hydro. Don't know what this diagram is? Try here: google.com/search?client=…
Note that by plotting a curve sans renewables, we get a clear view of the % share (shaded area). 9/x
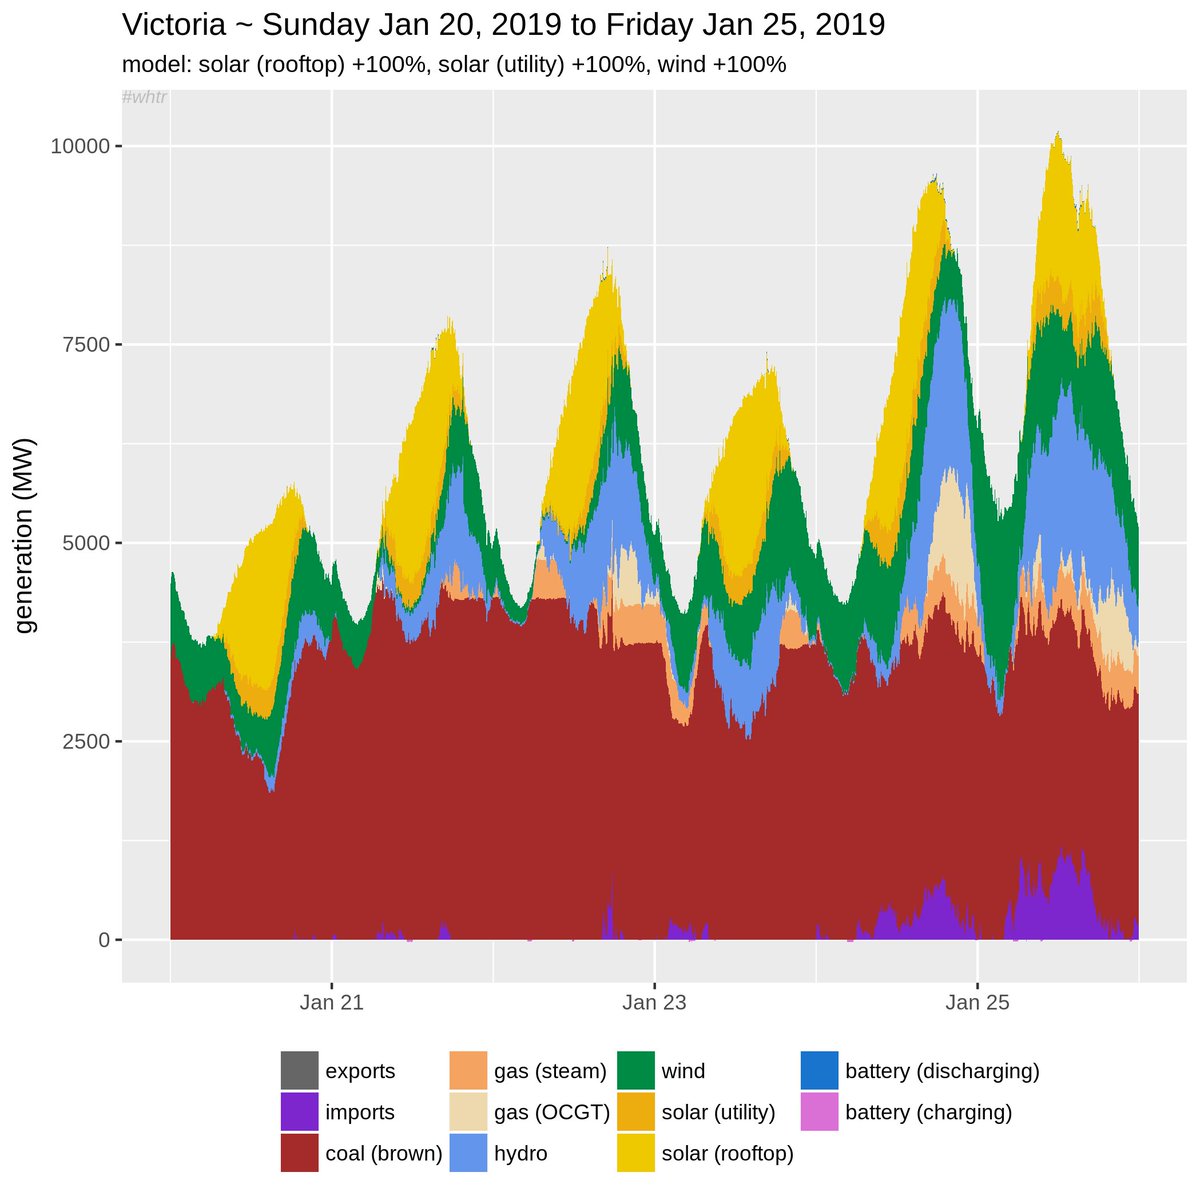
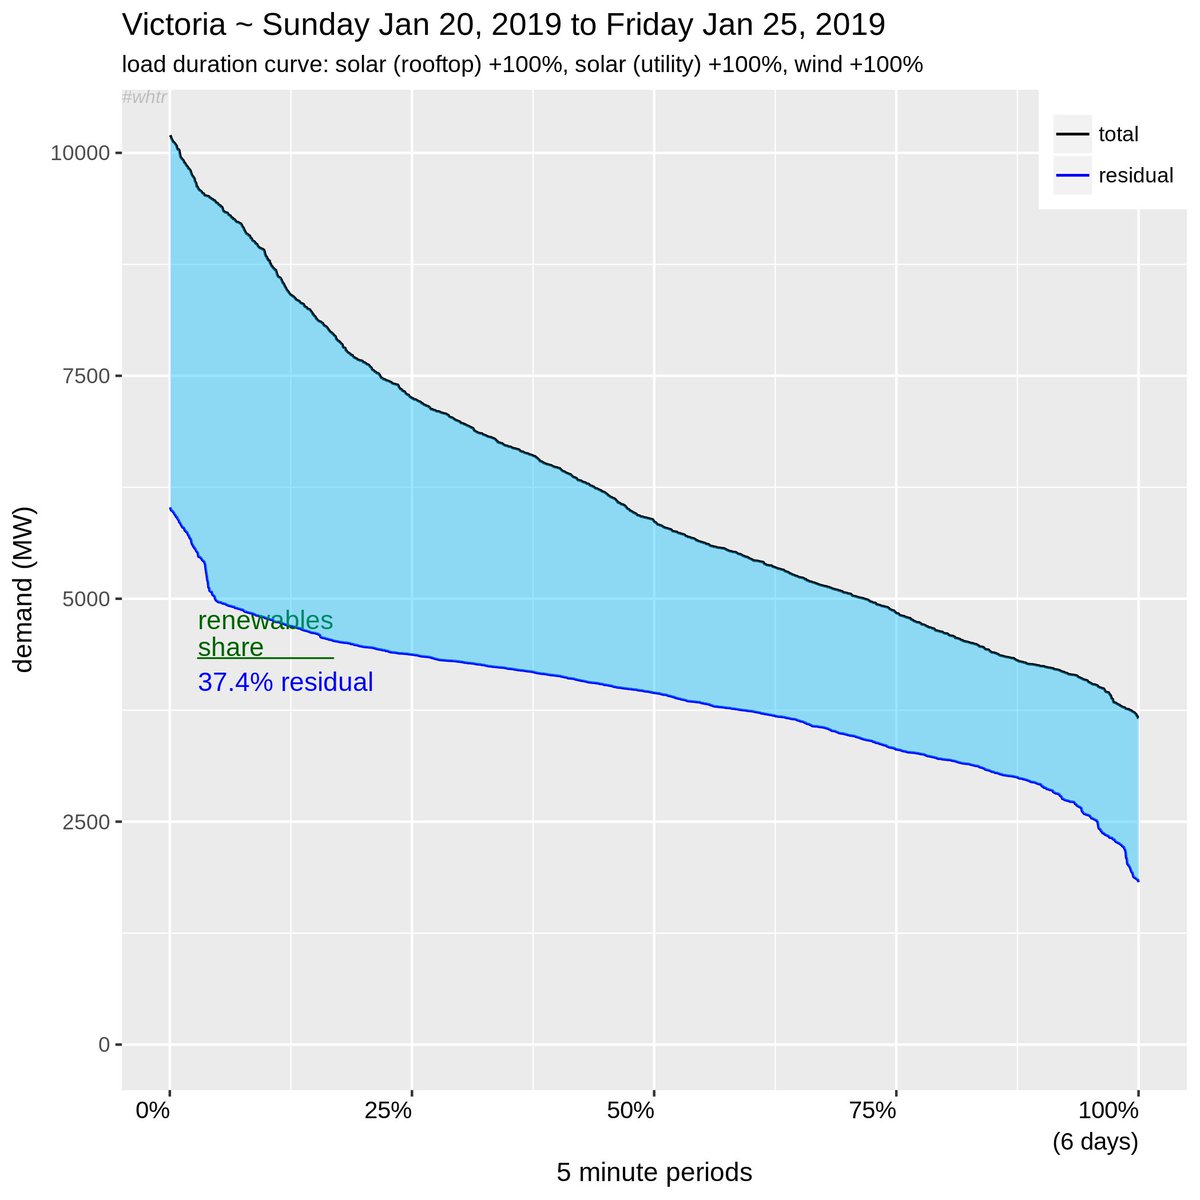
@GreenpeaceAP ok, now we are ready to take on what it really means to get your "reliable #renewableenergy" up & running. We'll start with doubling the amount of wind, as well as both utility & rooftop solar.
Note the renewable share is now at 37.4%, but still no where near enough. 10/x
Note the renewable share is now at 37.4%, but still no where near enough. 10/x
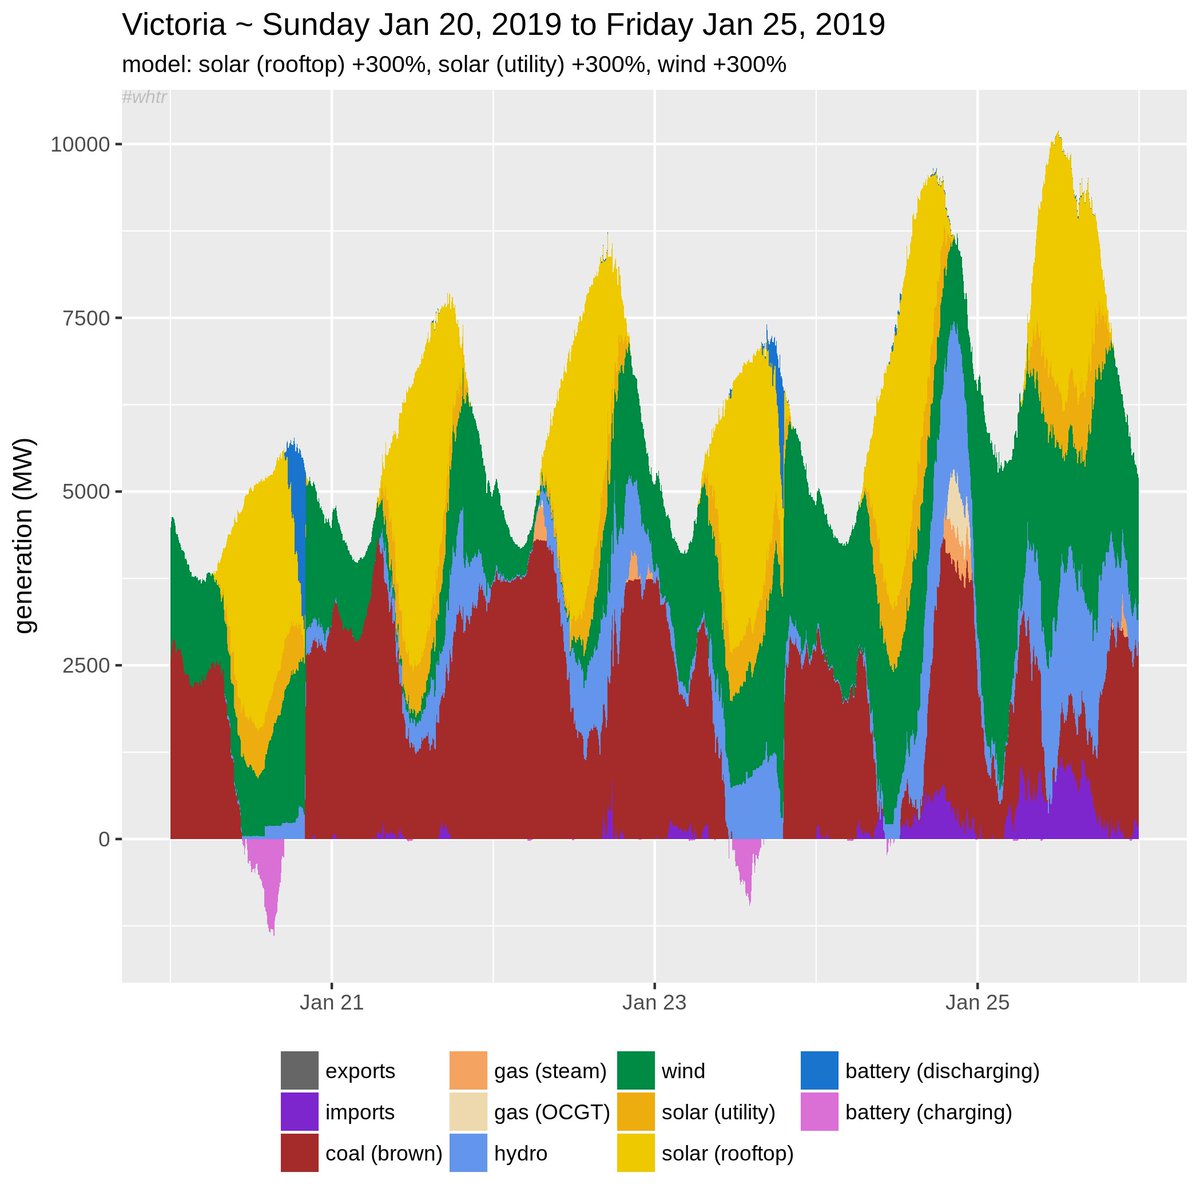
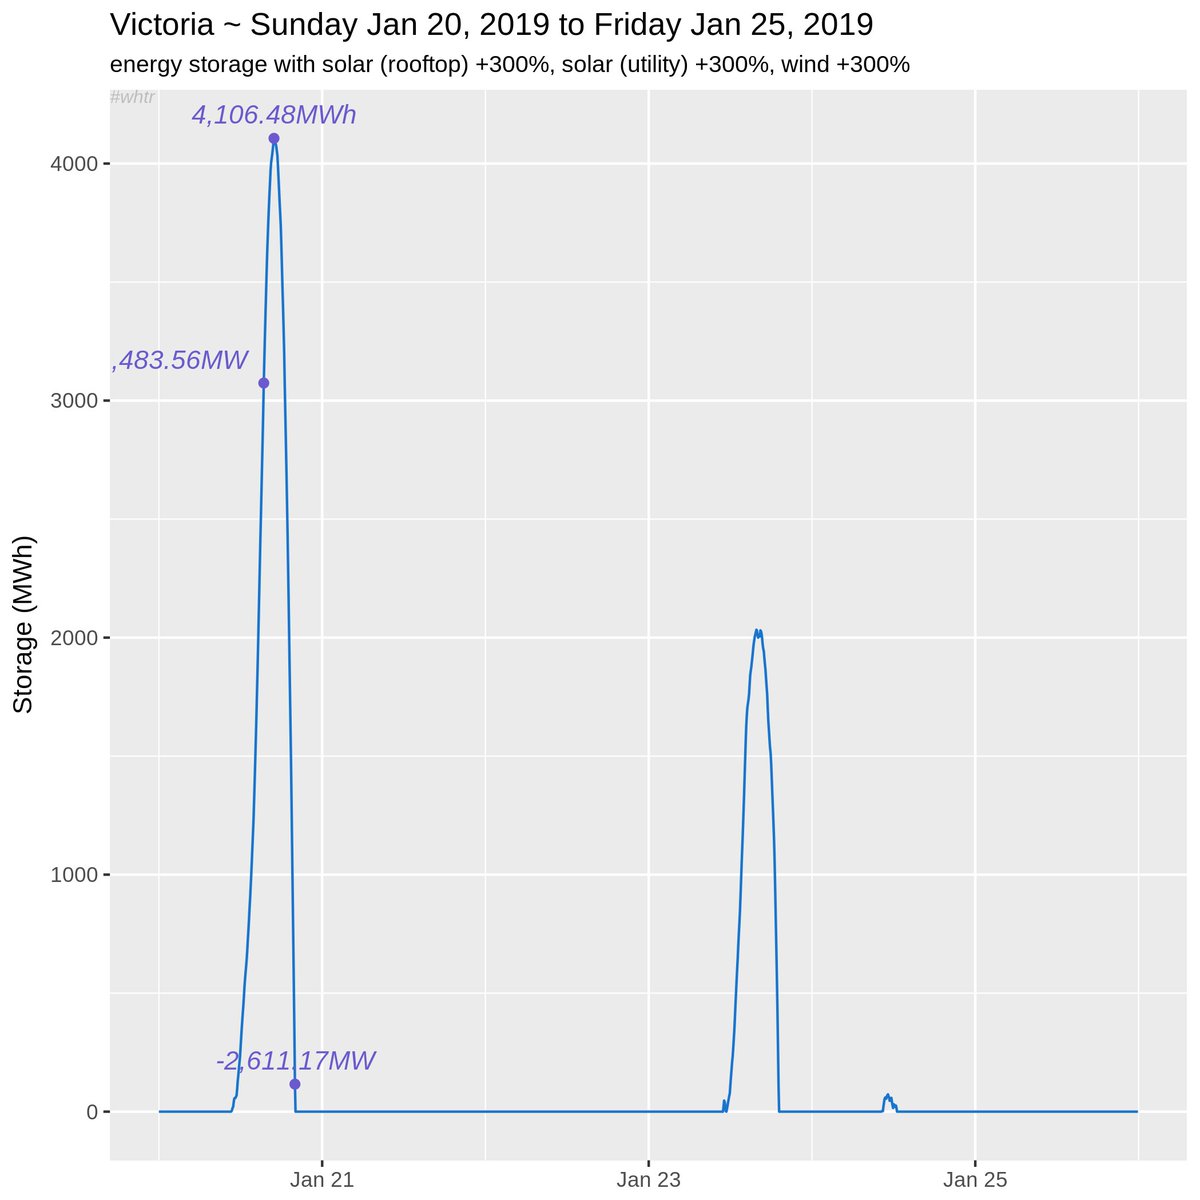
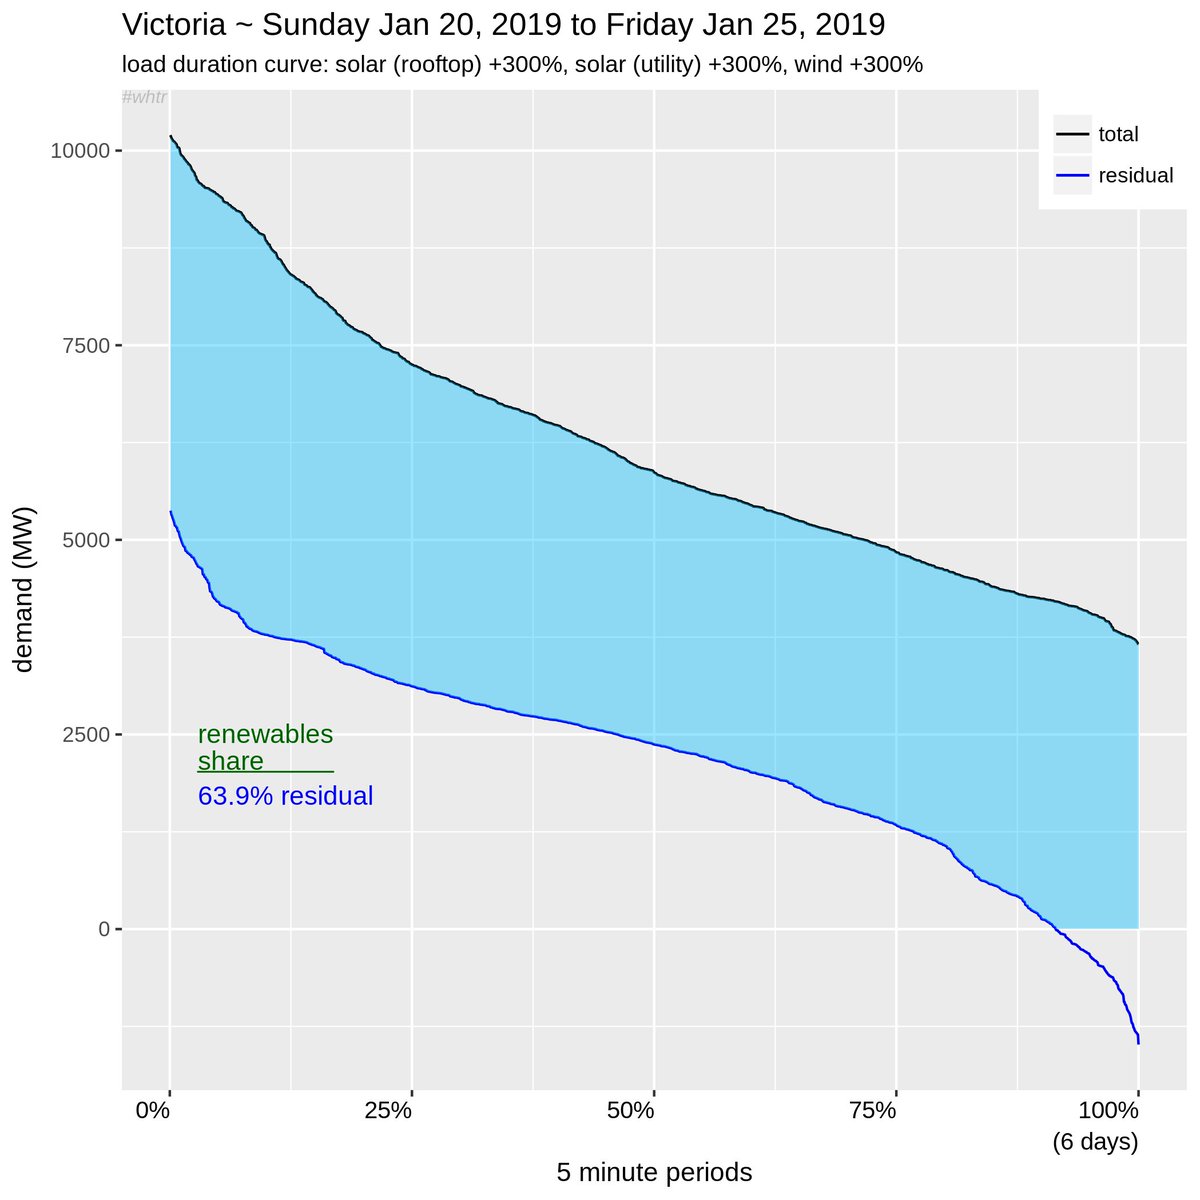
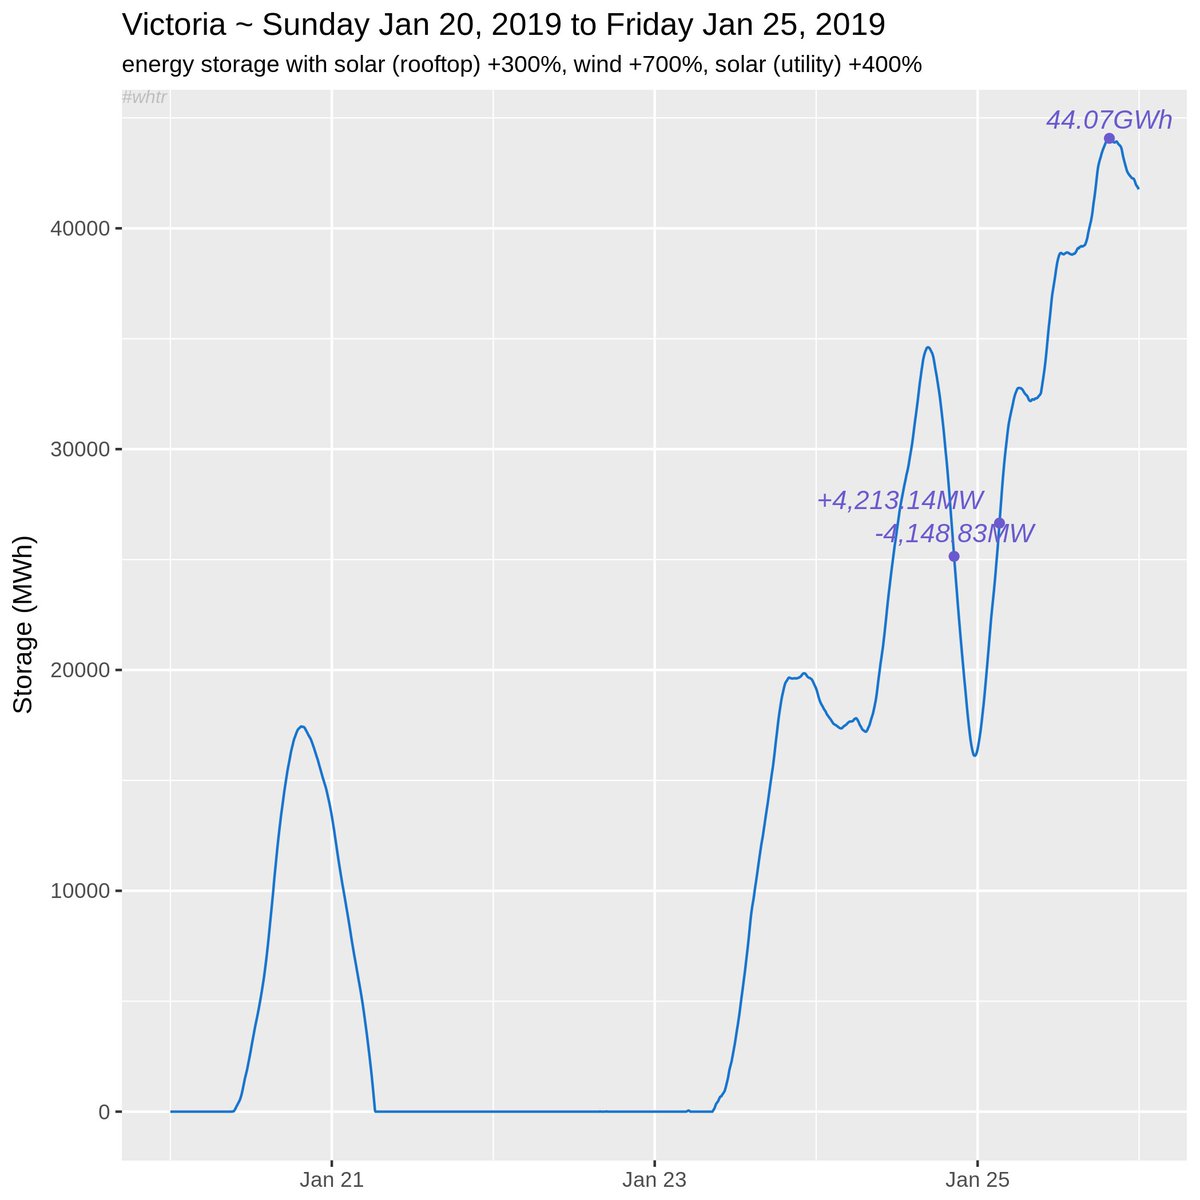
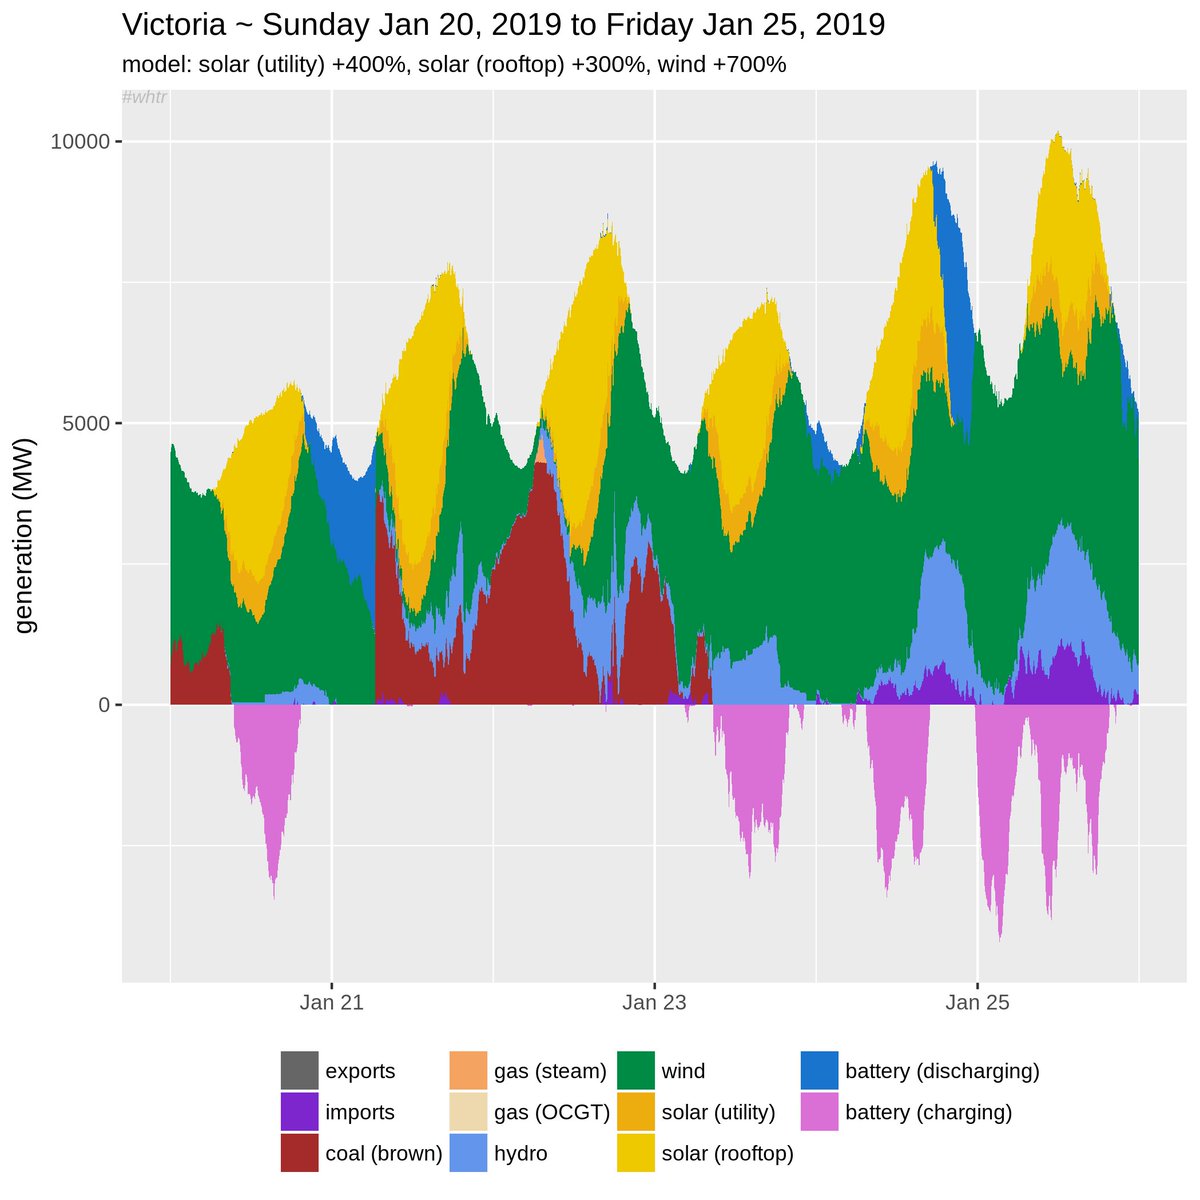
@GreenpeaceAP Time to get serious. Quadruple the lot!
Now we've got the over generation of renewables we can store for later. Cool.
64% renewables, with the over production (below the x-axis on the load duration curve diagram) going into storage.
~4GWh of storage doesn't do much but. 11/x
Now we've got the over generation of renewables we can store for later. Cool.
64% renewables, with the over production (below the x-axis on the load duration curve diagram) going into storage.
~4GWh of storage doesn't do much but. 11/x
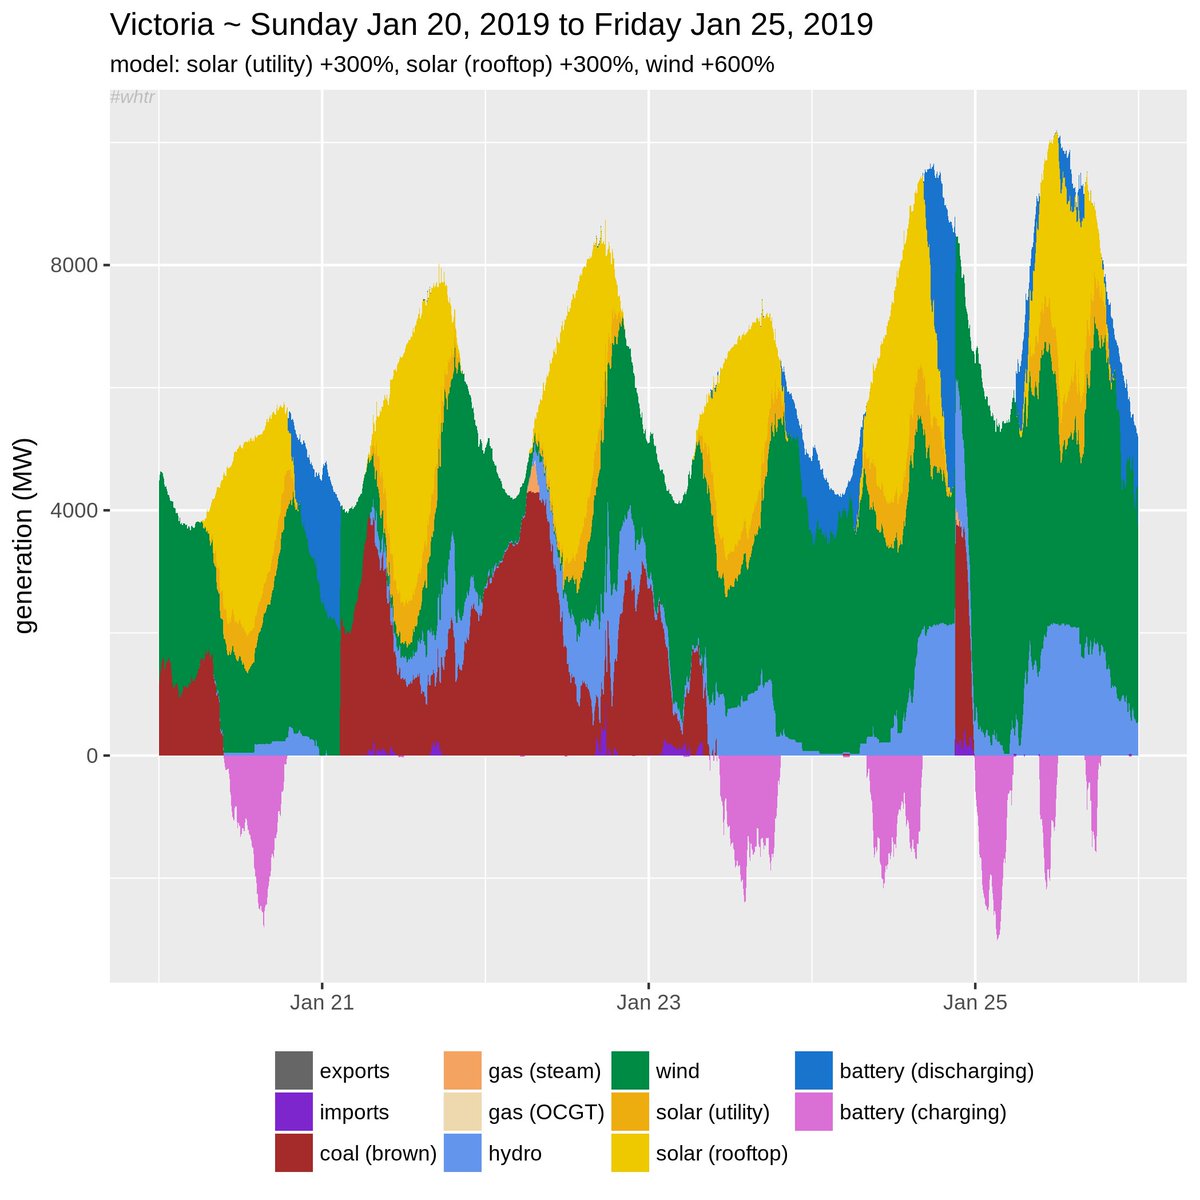
@GreenpeaceAP More! This time solar kept at x4, but wind gets a x7 factor.
<drum roll please>
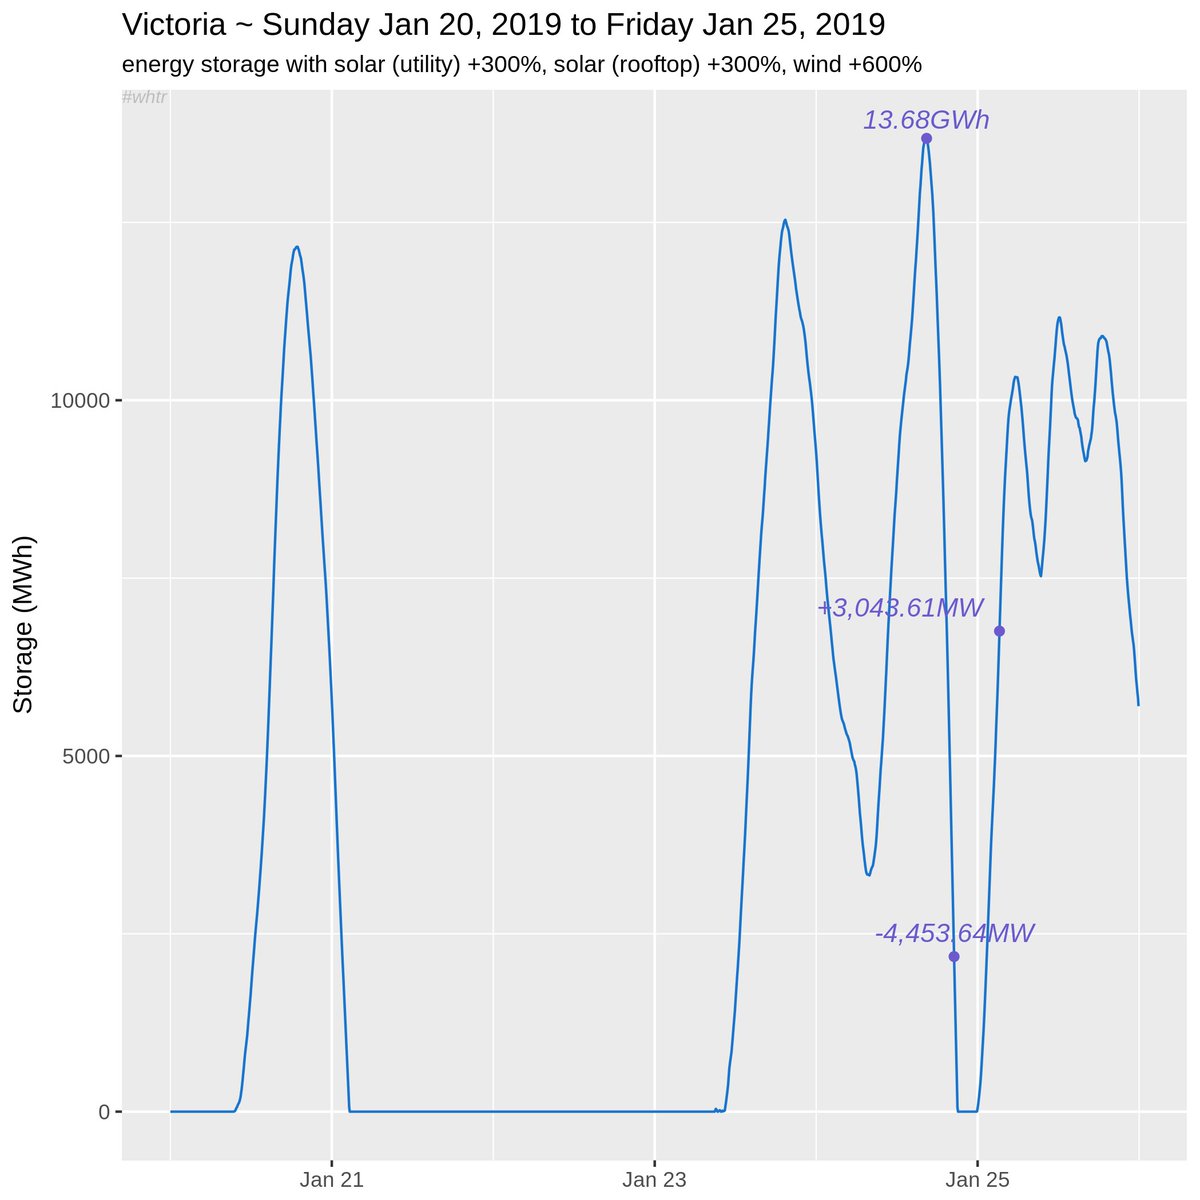
Success! Friday is now 💯% renewables!!! It does take 13.7GWh of storage. And there's an annoying spike of brown coal on Thursday. Plus Monday thru Wednesday isn't great. But still a win, right? 12/x
<drum roll please>
Success! Friday is now 💯% renewables!!! It does take 13.7GWh of storage. And there's an annoying spike of brown coal on Thursday. Plus Monday thru Wednesday isn't great. But still a win, right? 12/x
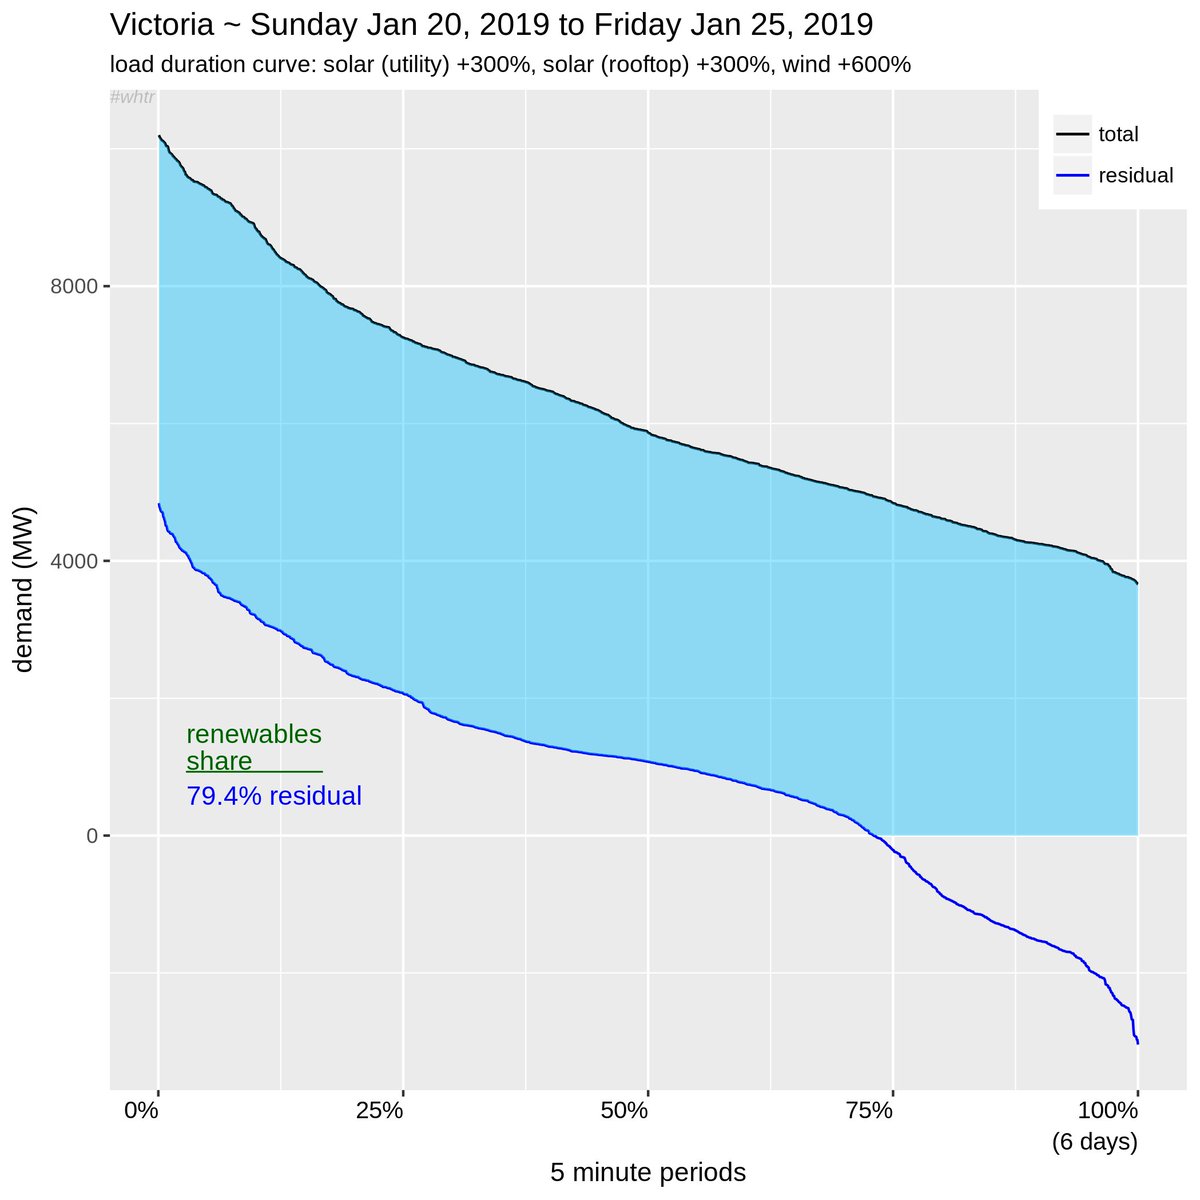
@GreenpeaceAP A brief pause to point out something interesting in the load duration curve. The right side of the (residual) curve keeps dropping, but the left hand side remains stubbornly high. This is a little something I'm calling #baseloadlimbo. Remember it for later. ~post-2030 #whtr 13/x
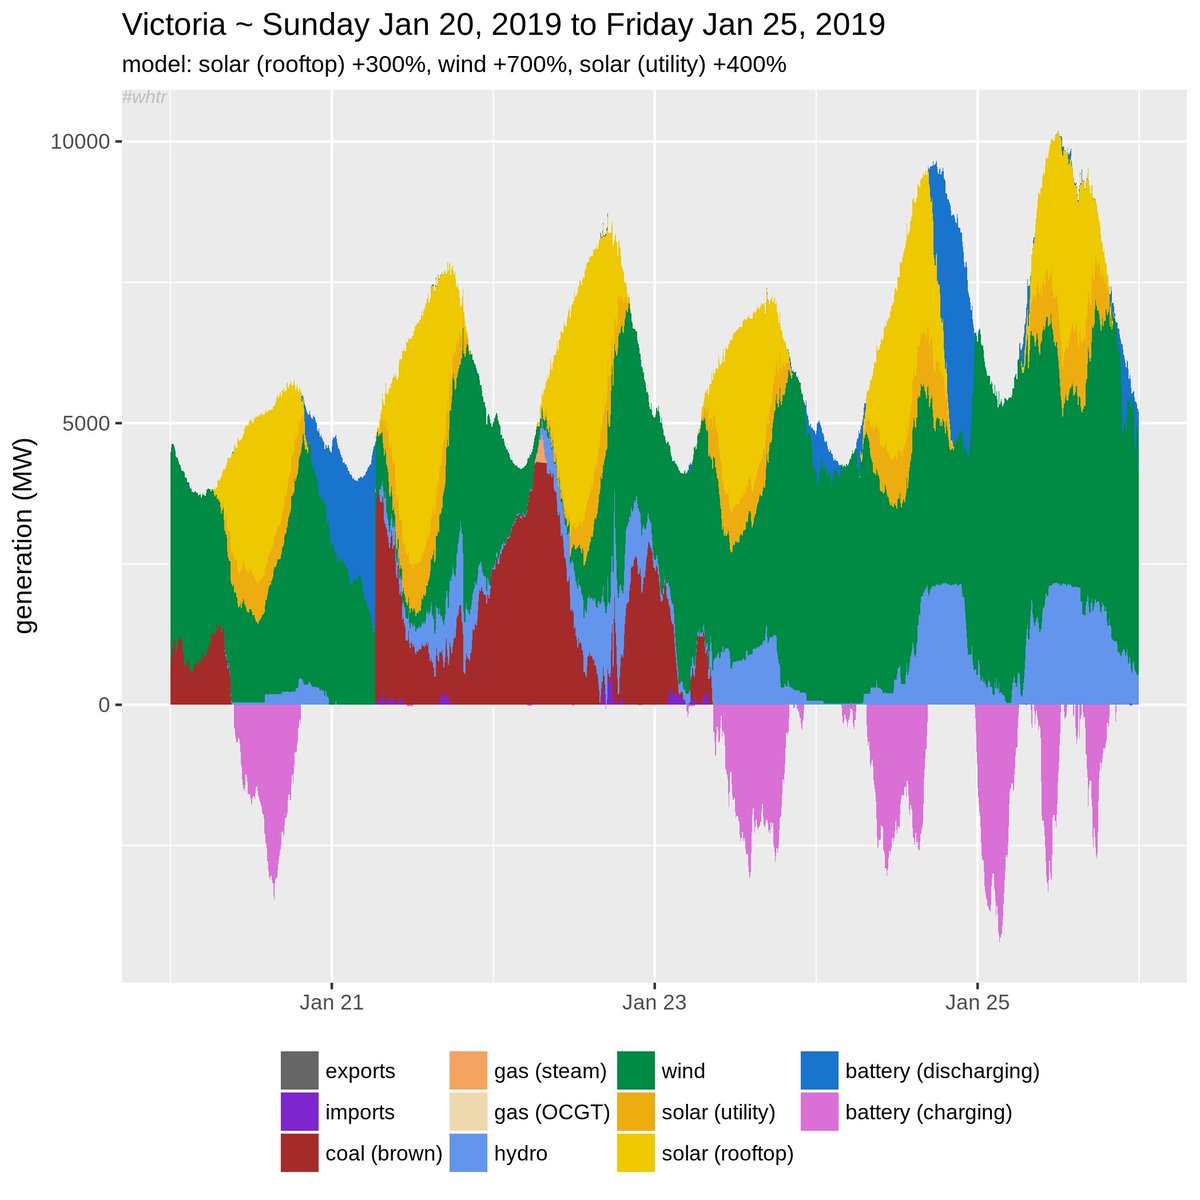
@GreenpeaceAP So back to it: rooftop solar x4, utility solar x5, and wind x8.
And just like that there's too much wind & solar over Thursday & Friday. If the storage doesn't exist, it just gets curtailed.
Not a problem you say? Well, it would be retailing at ~$0/kWh. 🤨 14/x
And just like that there's too much wind & solar over Thursday & Friday. If the storage doesn't exist, it just gets curtailed.
Not a problem you say? Well, it would be retailing at ~$0/kWh. 🤨 14/x

@GreenpeaceAP That's a problem if you are the people who have invested in all this new infrastructure. And are not getting a return on your investment. So if someone has worked out a way around this bug, now's the time for some ideas.
But if not, soon would be good. 15/x
But if not, soon would be good. 15/x
@GreenpeaceAP Now in the previous simulations, imports have been zeroed out. Since that is predominantly hydro out of Tasmania, let's bring it back.
Better. There's still brown coal (or similar) needed on Monday - Wednesday now. Potentially the hydro from Thur/Fri would be used instead. 16/x
Better. There's still brown coal (or similar) needed on Monday - Wednesday now. Potentially the hydro from Thur/Fri would be used instead. 16/x

@GreenpeaceAP …maybe
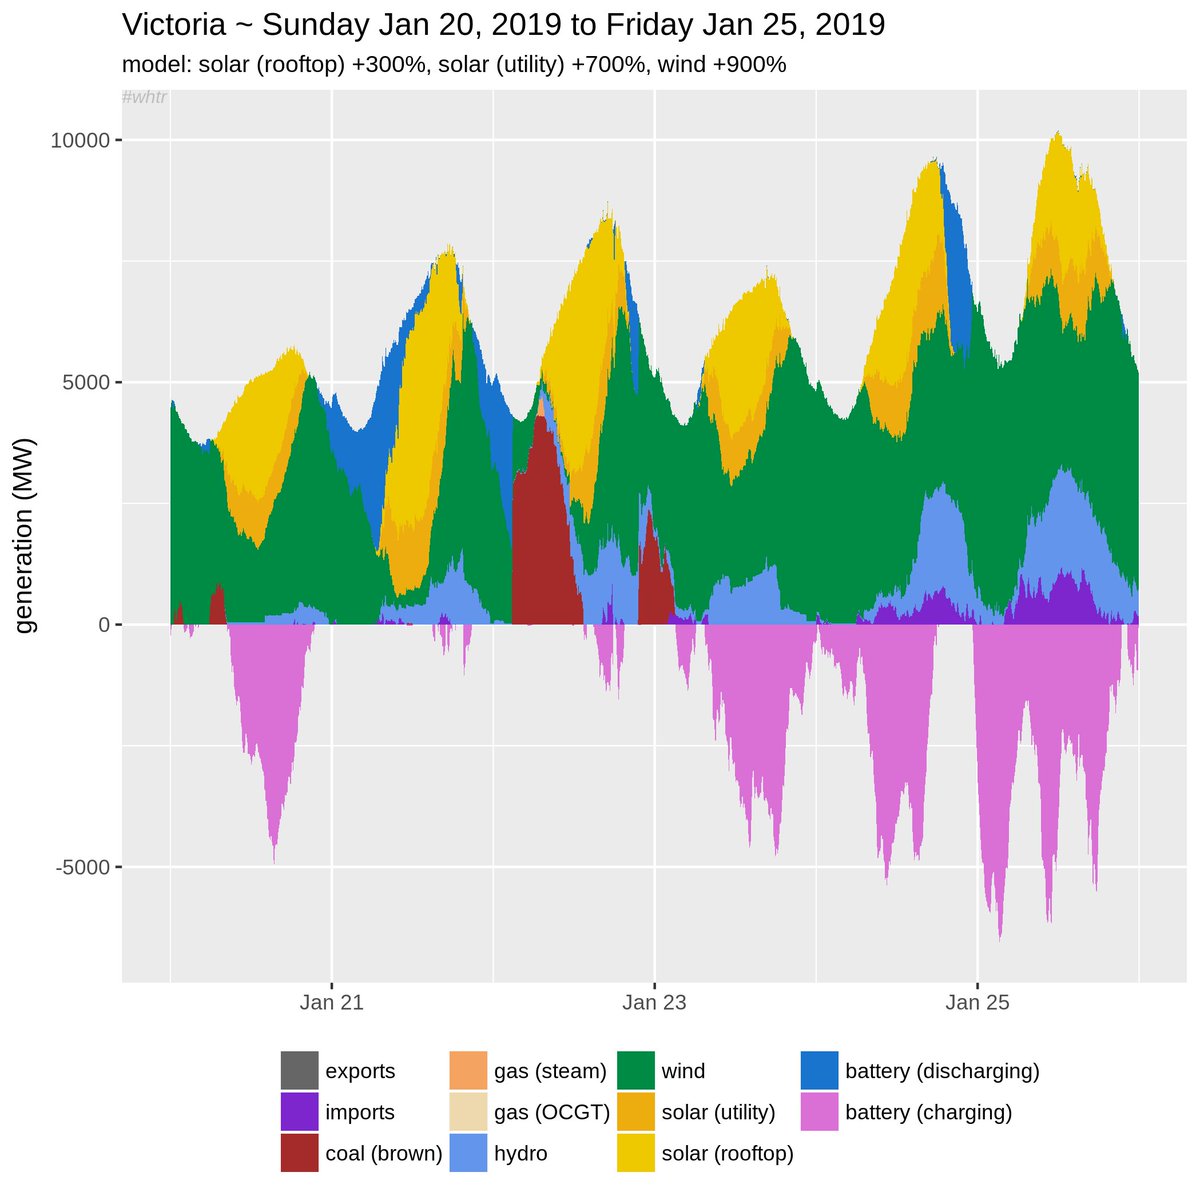
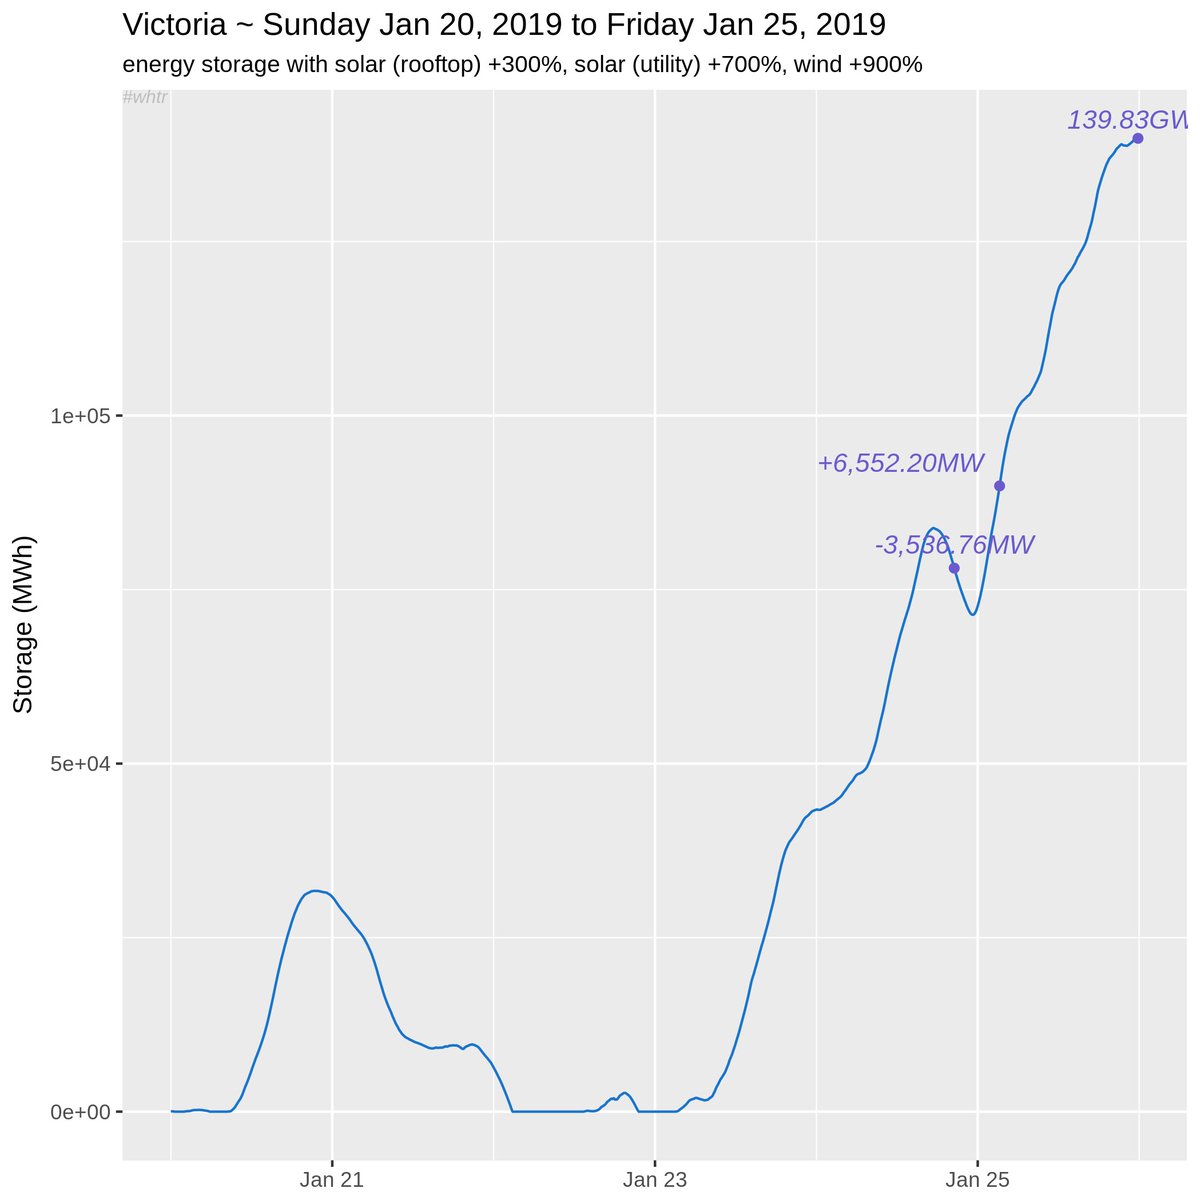
But let's just juice this up one last time: rooftop solar x4, utility solar x8, wind x10
Almost enough, but still not quite there.
And the storage issue starts to look a little nuts. 17/x
But let's just juice this up one last time: rooftop solar x4, utility solar x8, wind x10
Almost enough, but still not quite there.
And the storage issue starts to look a little nuts. 17/x
@GreenpeaceAP Note that over the weekend there was a session in Davos where they discussed the use of child labour in the cobalt mines of Congo. This is the cobalt that goes into all those Li-ion batteries you might want to use; phone, laptop, Tesla batteries.
You people are monsters. 18/x
You people are monsters. 18/x
@GreenpeaceAP (we *all* are already just quietly) 19/x
@GreenpeaceAP Don't doubt that this amount of storage (10s, if not 100s of GWh) will be *necessary*.
I should do a longer run of this simulation …there was that heatwave across South Australia, Victoria & NSW that lasted for days. Would have needed serious reserves, don't you think? 20/20
I should do a longer run of this simulation …there was that heatwave across South Australia, Victoria & NSW that lasted for days. Would have needed serious reserves, don't you think? 20/20