,
14 tweets,
5 min read
Read on Twitter
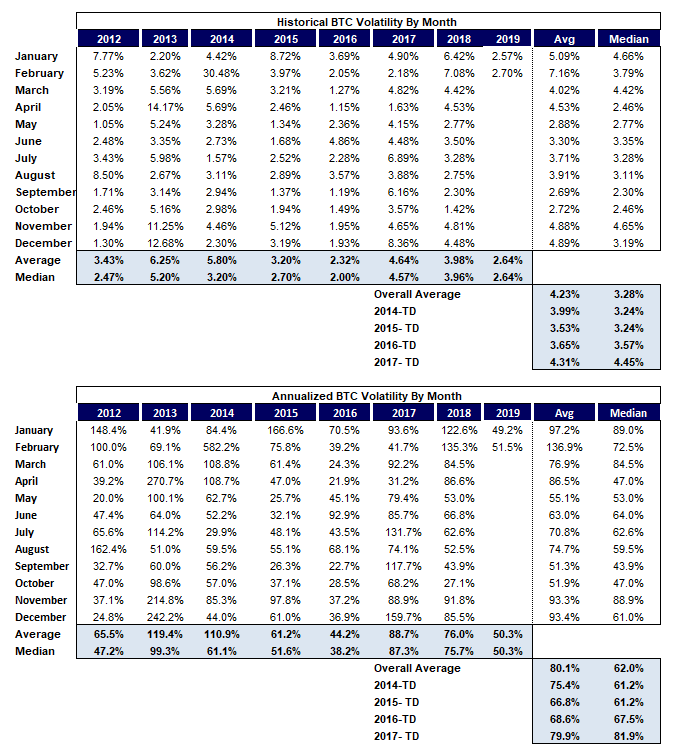
0/ February was the first positive month for $BTC performance since July of ’18 snapping a 6-month losing streak (the longest on record). And only the 3rd + month in the last 12. 

1/ Notably $BTC vol was ~50% annualized over the course of the month. The lowest volatility month that had positive $BTC performance since April ’17 (+32.5% and / 31.2% annualized vol).
2/ If we look at the difference between $BTC's “realized cap” and “market cap” on the month it was a blended -14.5% discount the third consecutive negative month following a similar trajectory of 2015.

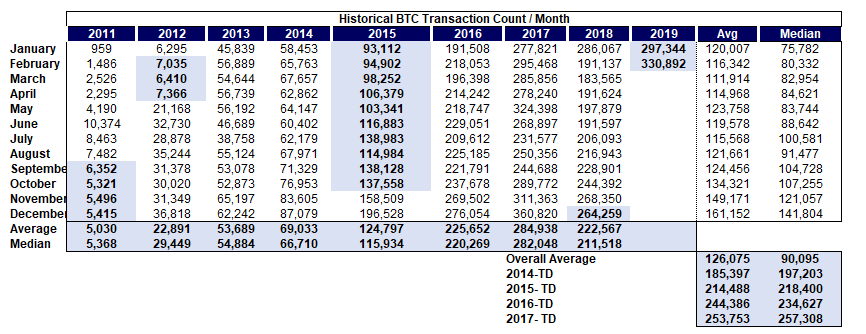
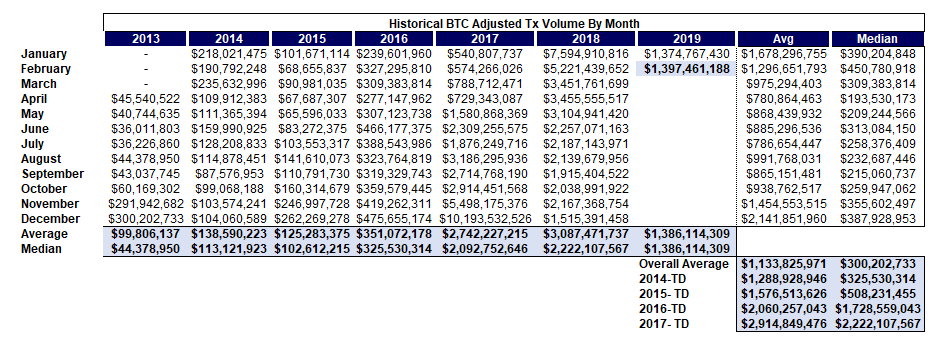
3/ If we look at number of $BTC transactions on a daily basis that continues to tick higher with the highest average daily value since Dec ’17. Yet adjusted tx volume per @coinmetrics (which is the better metric) continues to be at lower levels than the pre-’17 bull run.
4/ $BTC inflation has become more manageable with the daily number sitting right around $6.8mn. This has been the lowest 3 month average since July-Sept ’17 ($6.7mn vs. $6.65mn).

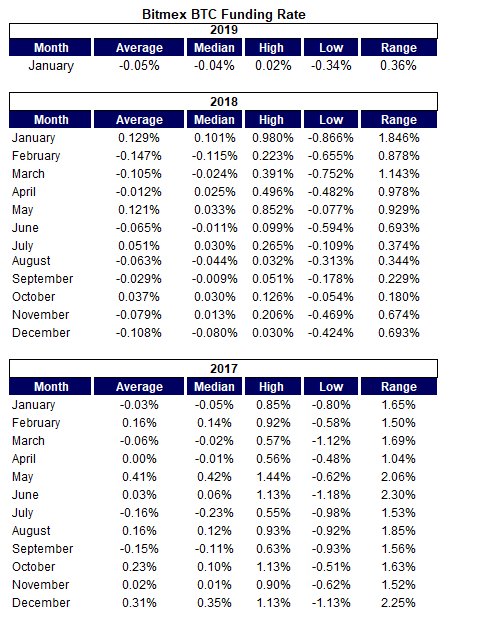
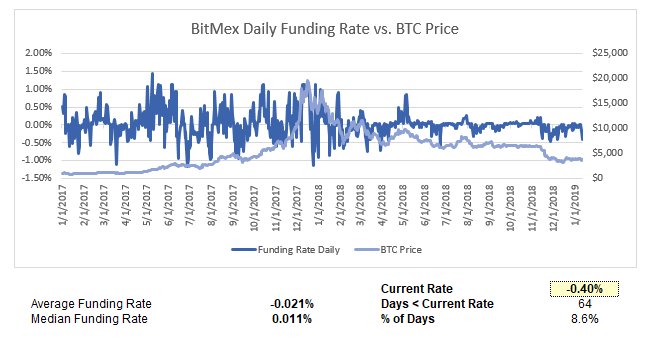
5/ If we look at leverage in the system February saw the tightest range in $BTC's funding rate on Bitmex in the past 2+ years (0.11%) with an average / median daily funding rate of -0.01% / 0.00%. Which coincided with that muted volatility.
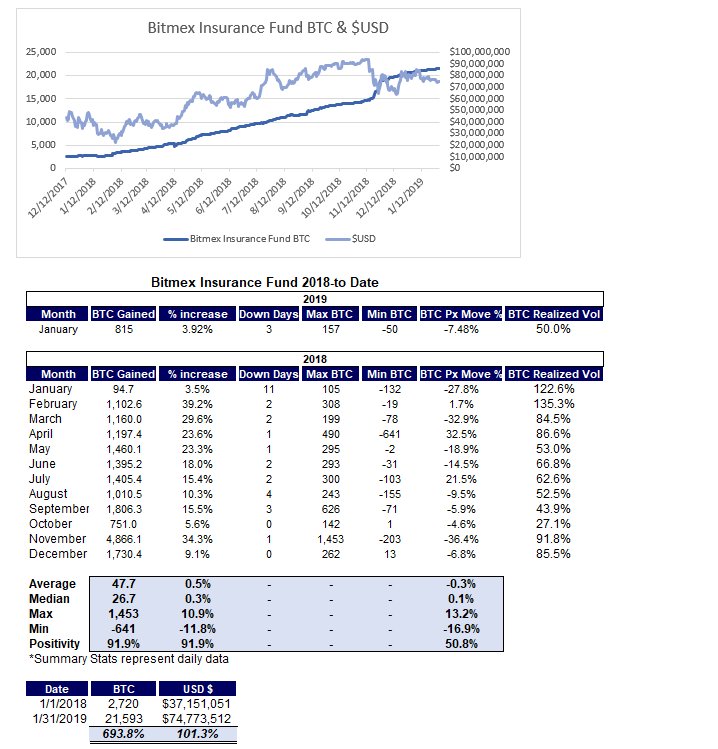
6/ This was the smallest monthly gain in the Bitmex insurance fund (101 $BTC) since 2016.


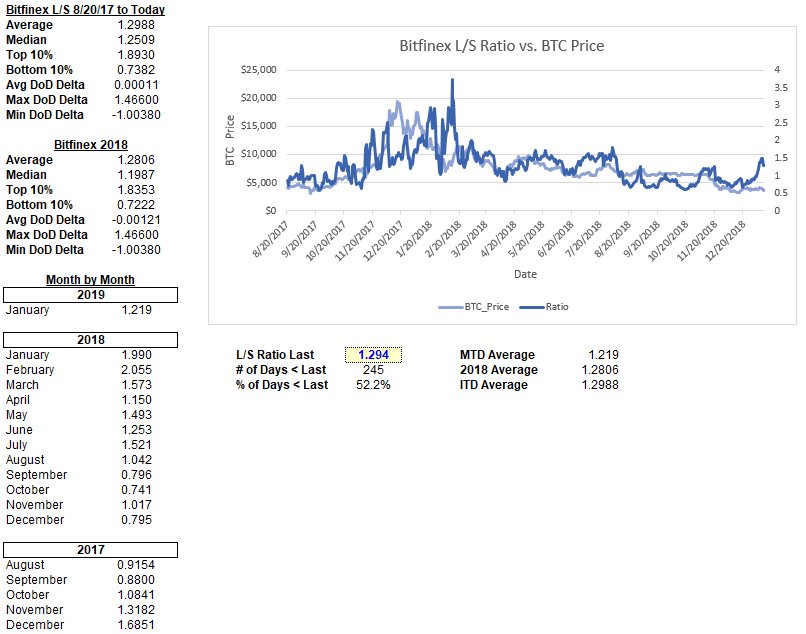
7/ The $BTC levered L/S ratio on Bitfinex had it’s highest daily average for a month since July of ’18 (1.352) and sits in the upper ~40% of observed periods but notably leverage for $BTC as a whole continues to pivot away from Bitfinex.

8/ Correlation remains elevated with $BTC's average blended correlation to top ~20 assets of ~85.7% in Feb slightly down from January but still higher than Dec ’18.

9/ As we look at $ETH it’s a more extreme story with February the second highest month on record in terms of daily funding cost on Bitmex (0.129%)

10/ While the $ETH levered L/S ratio saw it’s highest month since November of ’17 (2.212 average) and sits in the upper ~4.0% of observed periods.

11/ The $ETH L/S ratio has been above 2.0 for 20 consecutive days the longest such streak since 10/29/17-12/23/17 which was 56 straight days.
12/ Looking at volume overall it was the highest month since February of ’18 for aggregate ADV amongst Top 20 assets.

13/ Looking at volatility across a number of top assets February exhibited lower vol than ’17-’18 averages across the board (with the exception of $LTC).