,
21 tweets,
4 min read
Read on Twitter
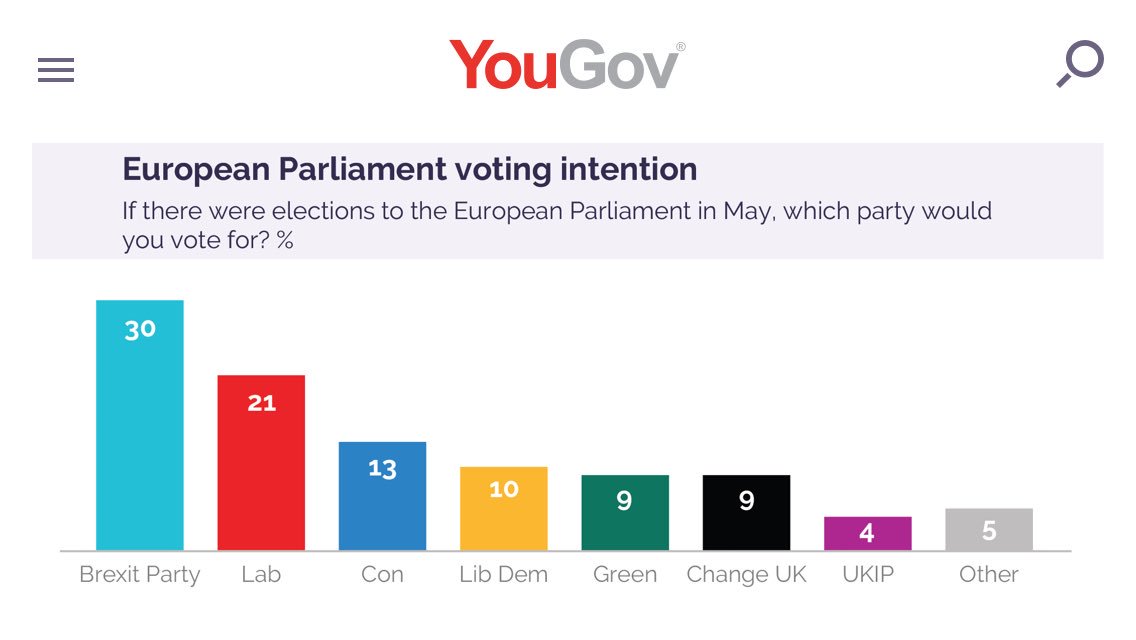
1/ A short thread on the YouGov poll on the #EUelections2019 #Poll
My own interpretations and views, using information from the YouGov website.
Headline is Brexit Party leading at 30% followed by Labour at 21%.
29-30 April
My own interpretations and views, using information from the YouGov website.
Headline is Brexit Party leading at 30% followed by Labour at 21%.
29-30 April
2/ So what can we learn from this poll beyond the headlines?
Firstly, it is a poll. Polls have a margin of error.
Next, the headline numbers exclude Don’t Know (DK) and Won’t Vote (WV).
This chart shows the extent of these categories 👇🏽
Firstly, it is a poll. Polls have a margin of error.
Next, the headline numbers exclude Don’t Know (DK) and Won’t Vote (WV).
This chart shows the extent of these categories 👇🏽

3/ As can be seen in the chart, DK topped the poll! Ahead of even the BP.
And WV came in 3rd, behind the BP but ahead of all other parties. More people stated they Will Not Vote than those who support the Labour Party. Astonishing really!
More about this later.
And WV came in 3rd, behind the BP but ahead of all other parties. More people stated they Will Not Vote than those who support the Labour Party. Astonishing really!
More about this later.
4/ Of the 30% planning to vote BP
- 25% voted Leave in 2016
- 4% did not vote in 2016
-1% voted Remain
No surprise here; these are Leave supporters.
Labour’s 21%:
12% Remain
3% Leave
6% DNV
Mostly remain then.
- 25% voted Leave in 2016
- 4% did not vote in 2016
-1% voted Remain
No surprise here; these are Leave supporters.
Labour’s 21%:
12% Remain
3% Leave
6% DNV
Mostly remain then.
5/ LibDem + TIG + Green = 28%:
19% Remain
3% Leave*
6% DNV
* somewhat surprising
19% Remain
3% Leave*
6% DNV
* somewhat surprising
6/ Those polled who voted Leave in 2016 plan to vote as follows in EU elections
- 60% BP
- 14% Tory
- 8% Lab
- 7% UKIP
- 7% TIG+Green+LibDem
Possibly scope here for the BP to increase their share of this. Particularly from UKIP.
- 60% BP
- 14% Tory
- 8% Lab
- 7% UKIP
- 7% TIG+Green+LibDem
Possibly scope here for the BP to increase their share of this. Particularly from UKIP.
7/ Of those who voted Remain the majority are planning to support Labour
- 32% Labour
- 17% LibDem
- 15% TIG
- 15% Green
- 12% Tory
Remain vote really is split, but Labour loyalties persist.
- 32% Labour
- 17% LibDem
- 15% TIG
- 15% Green
- 12% Tory
Remain vote really is split, but Labour loyalties persist.
8/ Support split by socio-economic group is interesting, Higher/Lower:
Aggregate 57/ 43
Labour 57/43
Tory 57/43
BP 53/47
LibDem 74/26
Green 65/35
TIG 69/31
UKIP 31/69
UKIP mainly lower, LibD+Green+TIG upper. BP+Lab+Tory relatively representative.
NB these are by EU intentions
Aggregate 57/ 43
Labour 57/43
Tory 57/43
BP 53/47
LibDem 74/26
Green 65/35
TIG 69/31
UKIP 31/69
UKIP mainly lower, LibD+Green+TIG upper. BP+Lab+Tory relatively representative.
NB these are by EU intentions
9/ By main region
LONDON (12% of voters)
23% BP
27% Lab
14% Con
34% LibDem+TIG+Green
REST OF SOUTH (33% of voters)
37% BP
13% Lab
13% Con
34% LibDem+TIG+Green
LONDON (12% of voters)
23% BP
27% Lab
14% Con
34% LibDem+TIG+Green
REST OF SOUTH (33% of voters)
37% BP
13% Lab
13% Con
34% LibDem+TIG+Green
10/ cont..
MIDLANDS/WALES (22% of voters)
32% BP
21% Lab
17% Con
23% LibDem+TIG+Green
NORTH (24% of voters)
31% BP
31% Lab
9% Con
23% LibDem+TIG+Green
MIDLANDS/WALES (22% of voters)
32% BP
21% Lab
17% Con
23% LibDem+TIG+Green
NORTH (24% of voters)
31% BP
31% Lab
9% Con
23% LibDem+TIG+Green
11/ In all regions the Brexit Party is above 30% apart from London, where it is still doing well at 23%.
Lab strong-hold is North (but still tied with BP there). The unambiguously Remain parties combined are strong in the South incl. London, but relatively weak in the North
Lab strong-hold is North (but still tied with BP there). The unambiguously Remain parties combined are strong in the South incl. London, but relatively weak in the North
12/ What can change significantly before the elections?
- BP already has 60% of those who voted Remain. Campaign momentum could possibly increase this, but the remaining 40% may have resilient Party ties ( 8% Lab, 14% Tory, 7%UKIP).
- Lab and Remain already have 98% of Remain.
- BP already has 60% of those who voted Remain. Campaign momentum could possibly increase this, but the remaining 40% may have resilient Party ties ( 8% Lab, 14% Tory, 7%UKIP).
- Lab and Remain already have 98% of Remain.
13/ There is a huge pot of Don’t Know !
Many could be “shy” Brexit Party supporters, too shy even to admit to a pollster (my suspicion as to why polls underestimated Leave in 2016). Fear of being called xenophobe etc.
Let’s take a closer look at them ....
Many could be “shy” Brexit Party supporters, too shy even to admit to a pollster (my suspicion as to why polls underestimated Leave in 2016). Fear of being called xenophobe etc.
Let’s take a closer look at them ....
14/ Don’t knows are 21% of the poll:
Split into how they voted in 2016:
Remain 8%
Leave 7%
DNV 7%
Some of the remainers may be undecided about which Remain party to support. Highest prop. are in South, lowest in London.
BP fighting for 7%, the 8% likely to be split.
Split into how they voted in 2016:
Remain 8%
Leave 7%
DNV 7%
Some of the remainers may be undecided about which Remain party to support. Highest prop. are in South, lowest in London.
BP fighting for 7%, the 8% likely to be split.
15/ Finally the 14% who say they Would Not Vote. This 14% splits (2016 ref):
Remain 3%
Leave 6%
DNV 5%
A lot of the Leave 6% may be disgruntled with politics; failure to deliver brexit, etc. BP definitely has an opportunity to woo these people back.
Remain 3%
Leave 6%
DNV 5%
A lot of the Leave 6% may be disgruntled with politics; failure to deliver brexit, etc. BP definitely has an opportunity to woo these people back.
16/ BP strength is that they attract the lion’s share of the Leave supporters, whereas the other parties have to split the Remain support plus what’s left over of the Leavers.
Complicating this is traditional party loyalties and confusion over Lab and Tory stance on brexit.
Complicating this is traditional party loyalties and confusion over Lab and Tory stance on brexit.
17/ If the elections became framed as a 2nd vote on EU membership and not as an election of EU representatives to manage the UK’s ongoing participation in the EU (business as usual), then the BP has still has considerable upside from the 30%. They have......
18/ ...only captured 60% of those who voted Leave so far.
Concomitantly the other parties would have downside risk as they could bleed the leave voters currently planning to vote for them.
Concomitantly the other parties would have downside risk as they could bleed the leave voters currently planning to vote for them.
19/ Lastly, there is the usual question of intentions and actions; who will turnout and vote and who won’t? Any likely biases in stated commitments in the various groups?
20/ That’s is from me, folks. Any errors all mine. This has nothing to do with YouGov apart from me using what they published on their website.
Hope you enjoyed this thread.
Hope you enjoyed this thread.
* typo: BP already has 60% of those who voted *Leave*