,
16 tweets,
16 min read
Read on Twitter
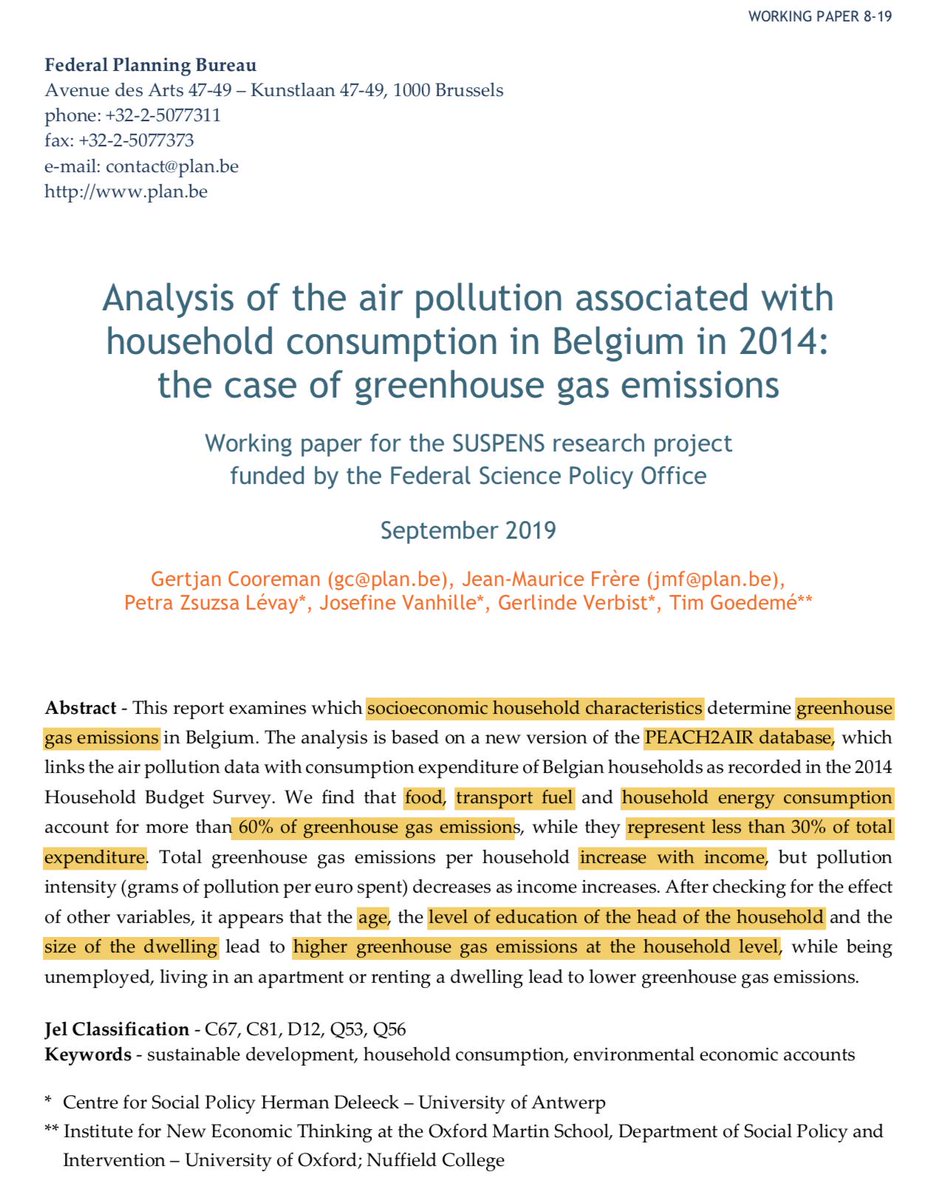
Recent report Belgian Planning Bureau @FPB_BE @BFP_BE @josefine_v @TimGoedeme [hyp.is/kzZ0mN8nEemkjU…] prooves need for a just and fair climate policy
*Food/transport/housing largest impact
*Impact ↗️ with age, education, income
@MathiasB9 @Apache_be @jnwlrvn @Dirk_Lauwers
*Food/transport/housing largest impact
*Impact ↗️ with age, education, income
@MathiasB9 @Apache_be @jnwlrvn @Dirk_Lauwers
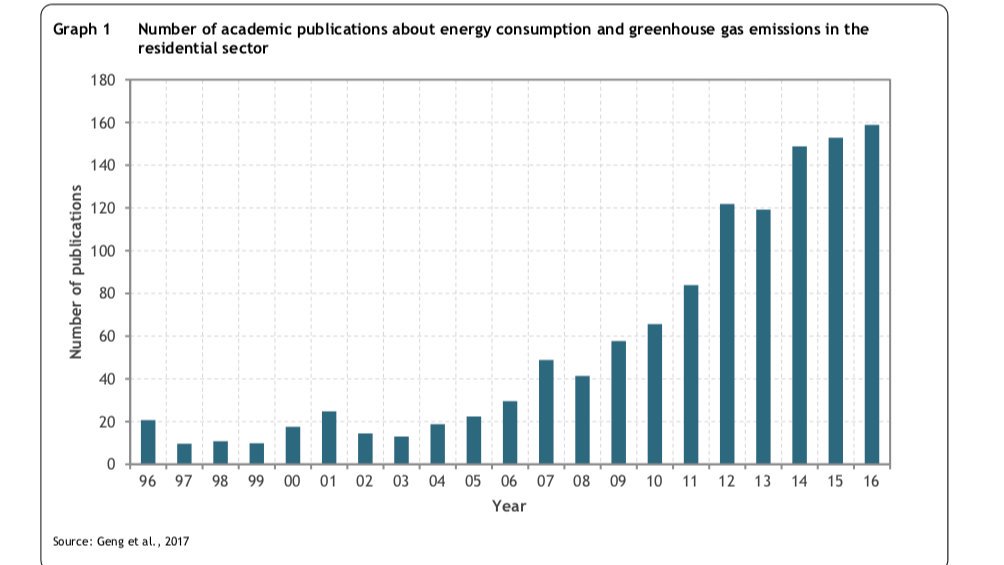
[1] Introduction:
💡Interesting literature review for those interested💡
💡Interesting literature review for those interested💡
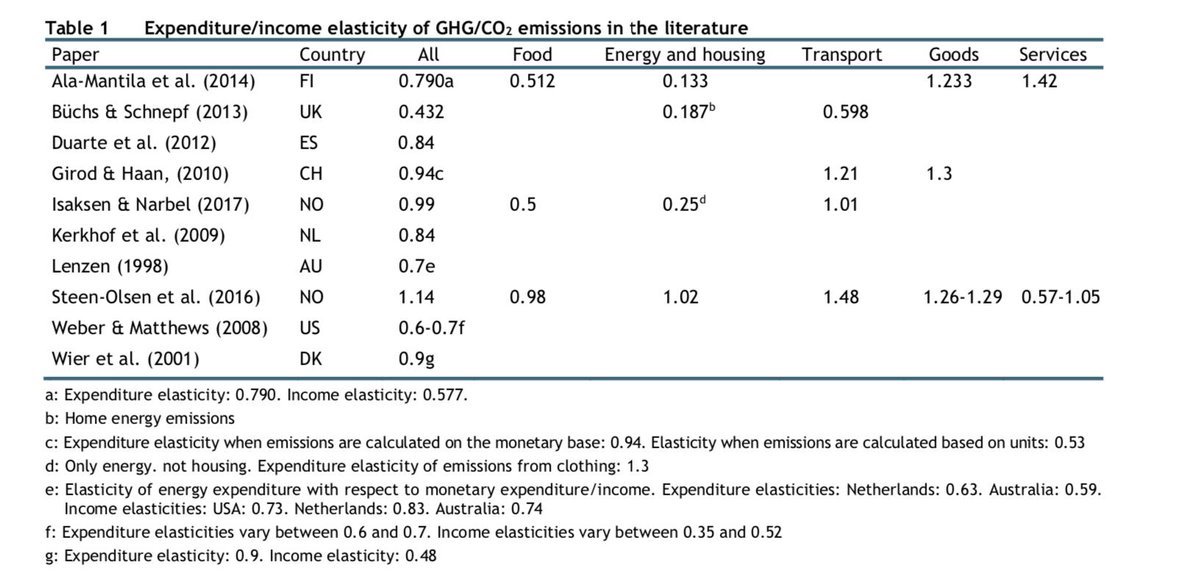
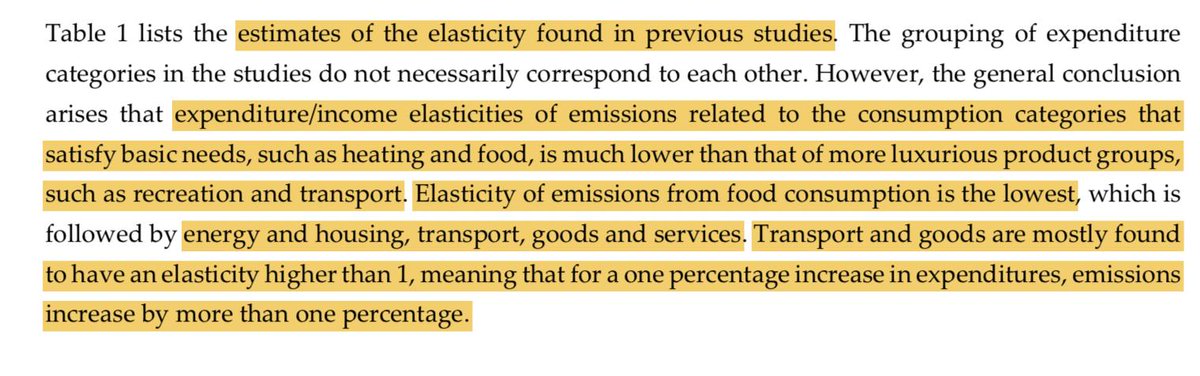
* Price elasticity literature (increased emissions with increased income) seem to suggest:
- Basic needs elasticity lower than for luxurious products
- Food is the lowest, followed by energy
- Transport and goods elasticity higher than 1 : price ↗️ 1% => emissions ↗️ > 1%
- Basic needs elasticity lower than for luxurious products
- Food is the lowest, followed by energy
- Transport and goods elasticity higher than 1 : price ↗️ 1% => emissions ↗️ > 1%
[2] Method & Data:
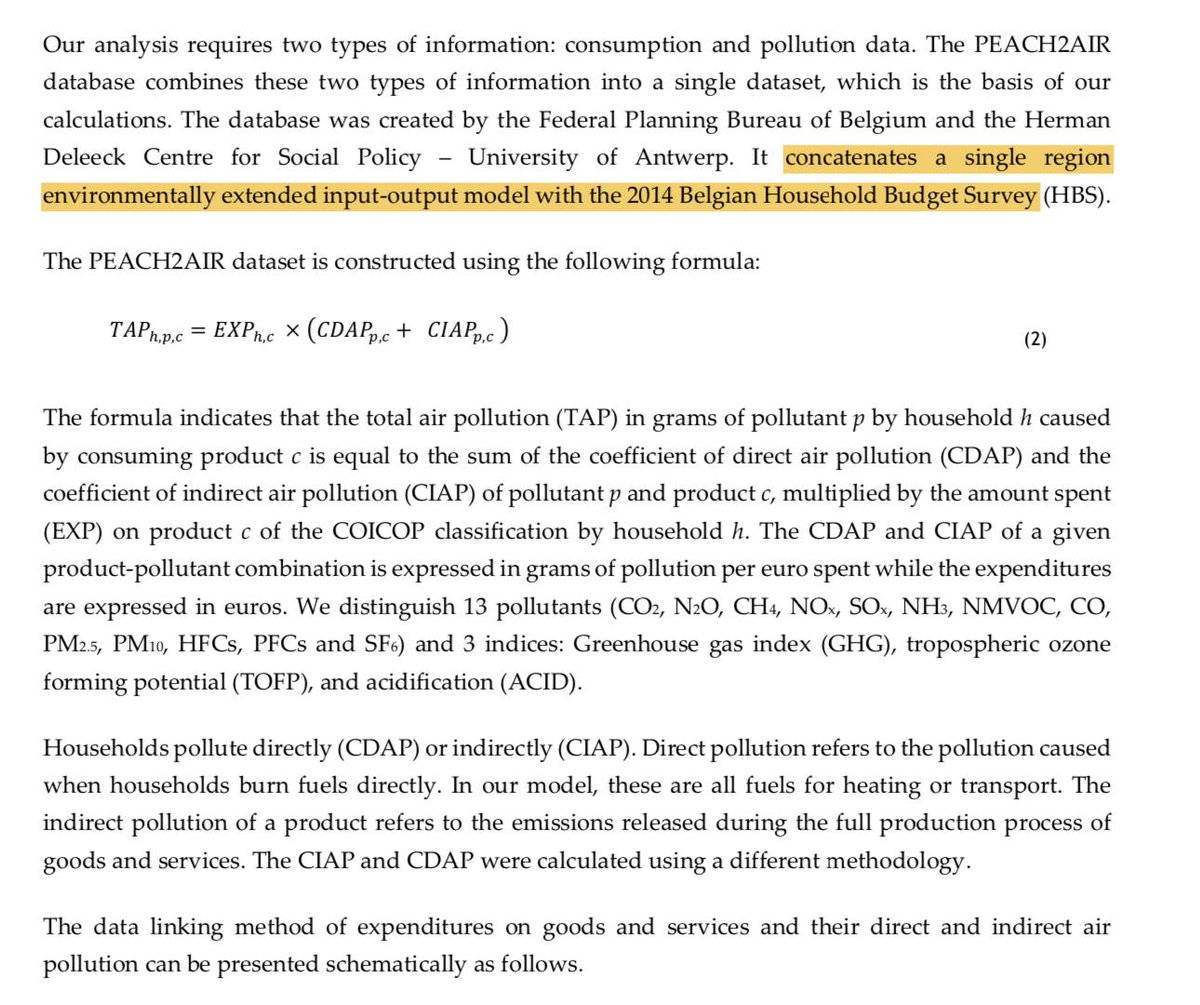
* Direct (heating/transport) and indirect (consumer goods) emissions are accounted for
* Direct (heating/transport) and indirect (consumer goods) emissions are accounted for
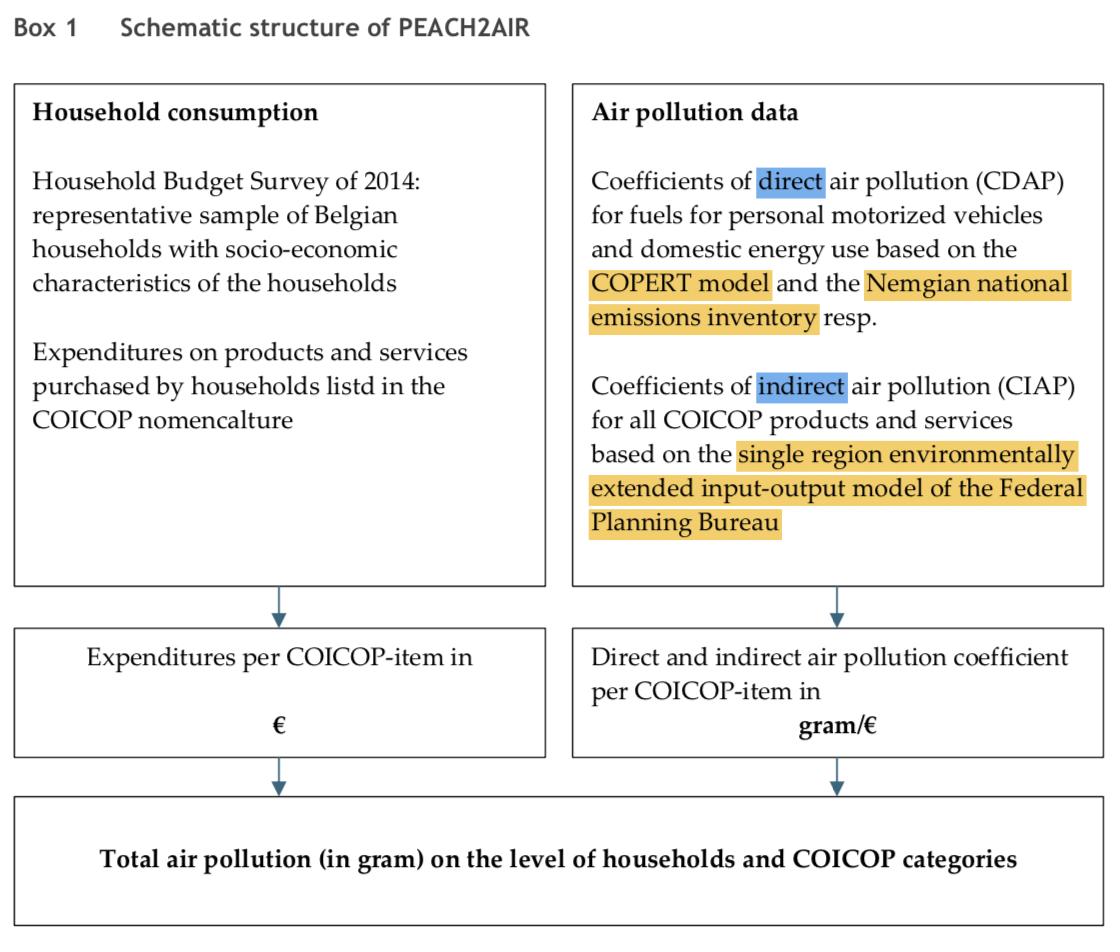
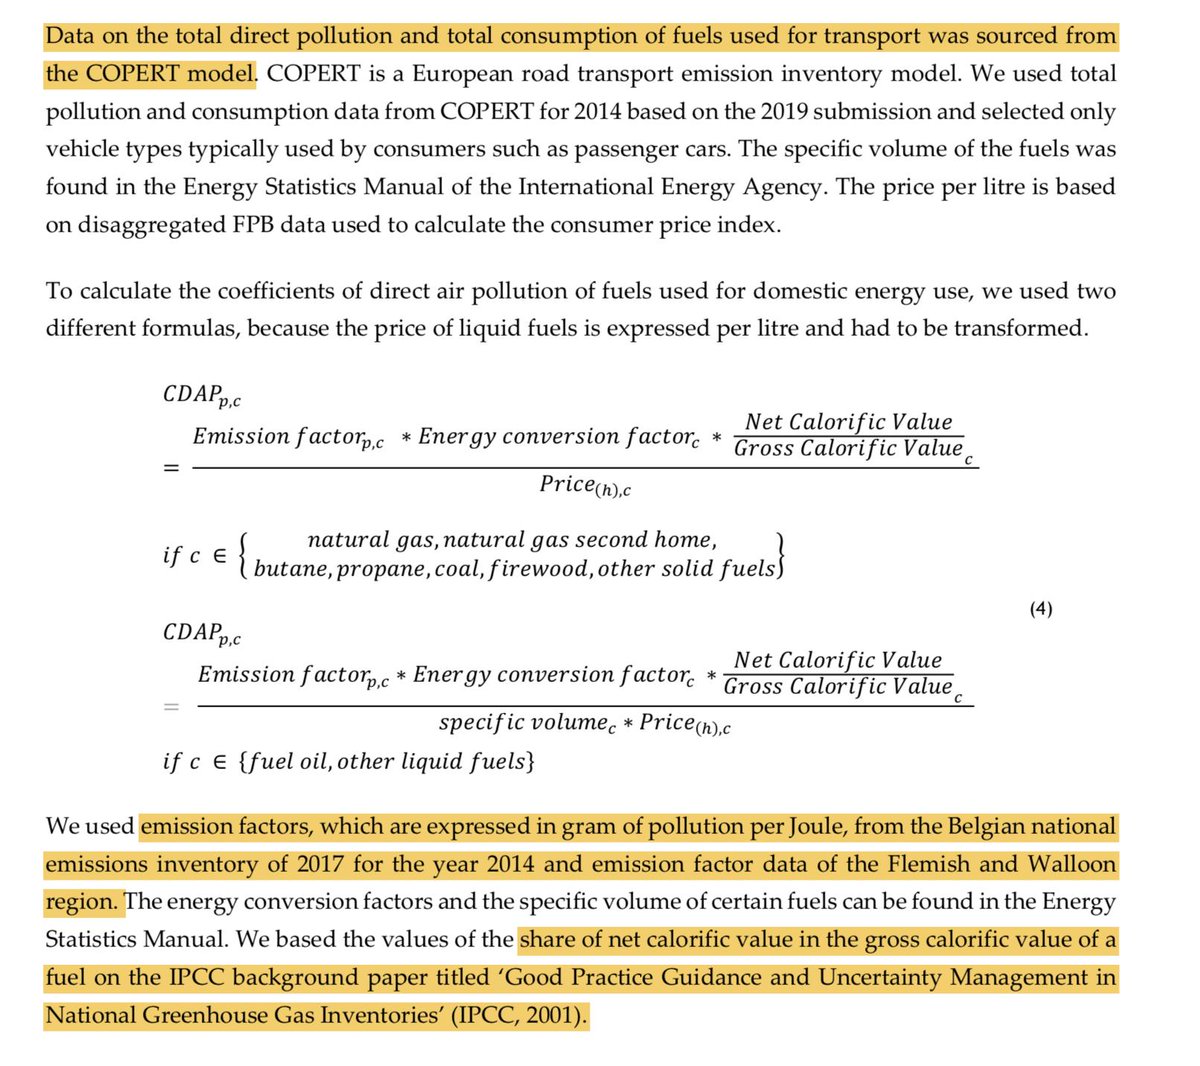
(a) Direct air pollution:
* EU COPERT transport model data
* Emission factors from Belgian national emissions inventory
* Net calorific value fuels from IPCC
* EU COPERT transport model data
* Emission factors from Belgian national emissions inventory
* Net calorific value fuels from IPCC
(b) Indirect air pollution: territorial environmentally-extended input-output model coupled with consumer expenditure survey, inclusion of emissions abroad.
No multi-regional model, as most detailed only has 162 industries.
[see als plan.be/admin/uploaded…]
@dr_anneowen
No multi-regional model, as most detailed only has 162 industries.
[see als plan.be/admin/uploaded…]
@dr_anneowen
(b*) Data notes:
* Homogenous production tech
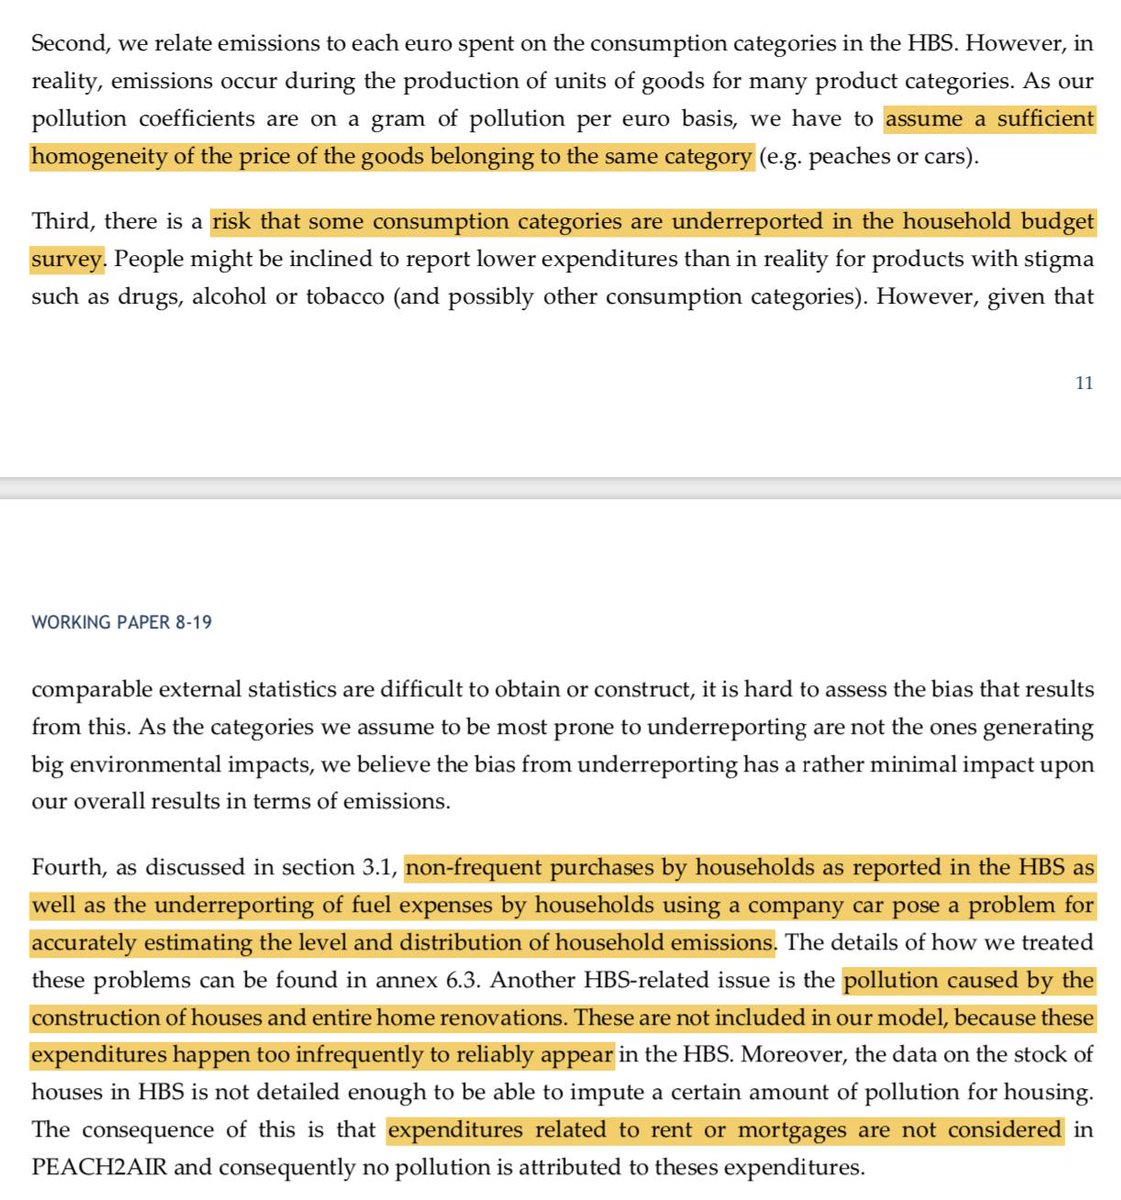
* Homogenous price same-cateogory products
* Risk of underreporting in survey, assumed minimal
* Underreporting company car fuel/non-frequent purchases
* Home renovation not included
* Public service consumption not always included
* Homogenous production tech
* Homogenous price same-cateogory products
* Risk of underreporting in survey, assumed minimal
* Underreporting company car fuel/non-frequent purchases
* Home renovation not included
* Public service consumption not always included
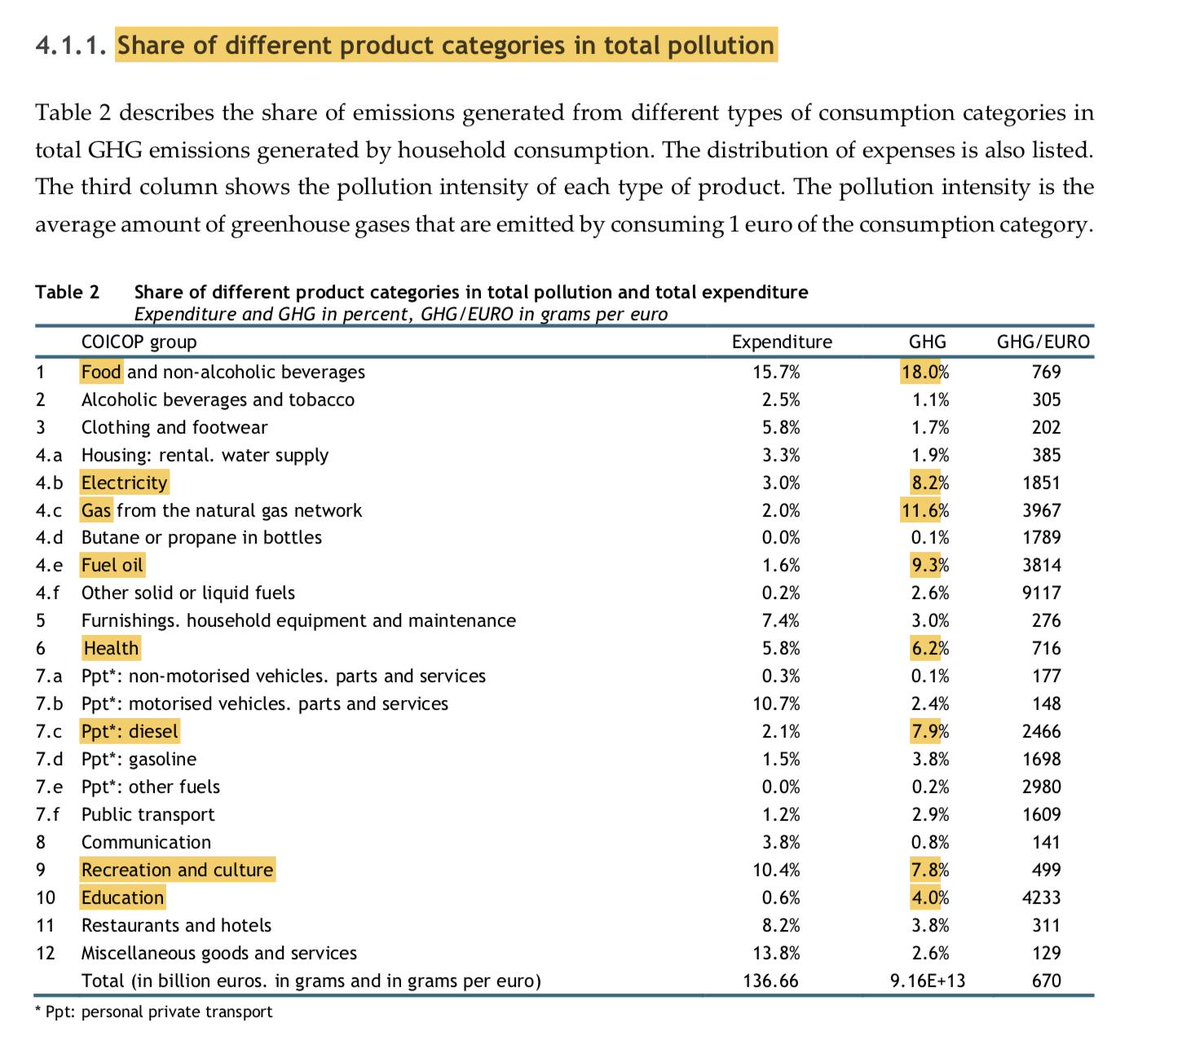
[3] Results: % GHG per consumption category, totals
* 18 % : Food/non-alcoholic beverages
* 31% : Domestic energy use
* 12% : Transport fuels
= 62.8 % of total GHG emissions
* 18 % : Food/non-alcoholic beverages
* 31% : Domestic energy use
* 12% : Transport fuels
= 62.8 % of total GHG emissions
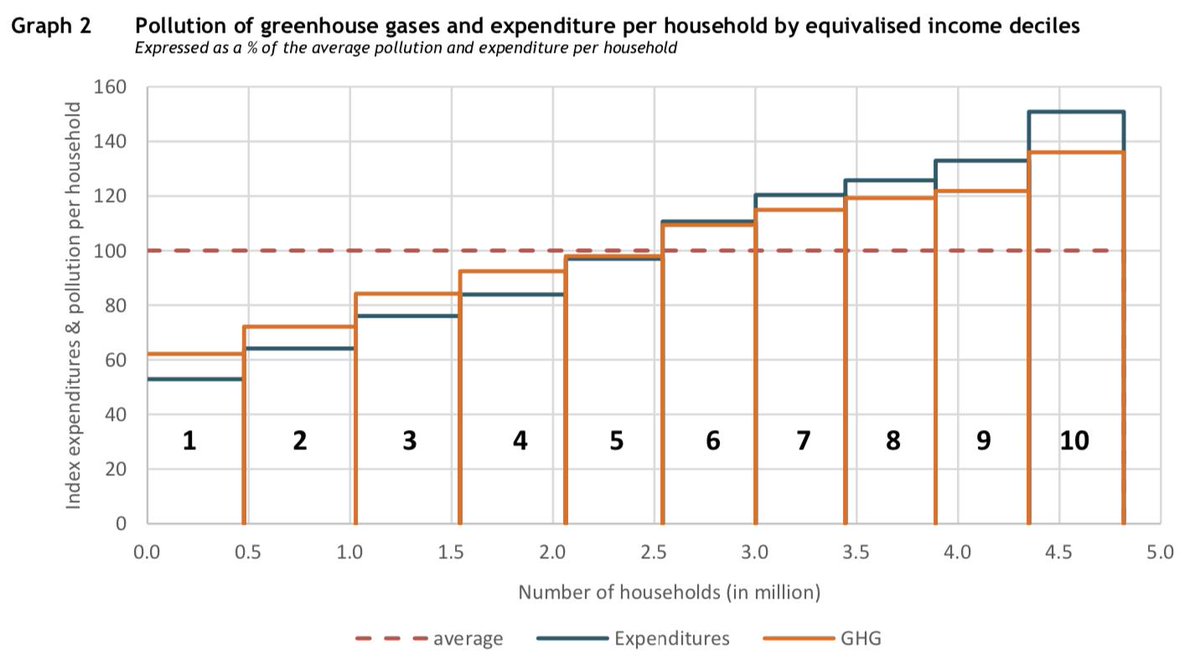
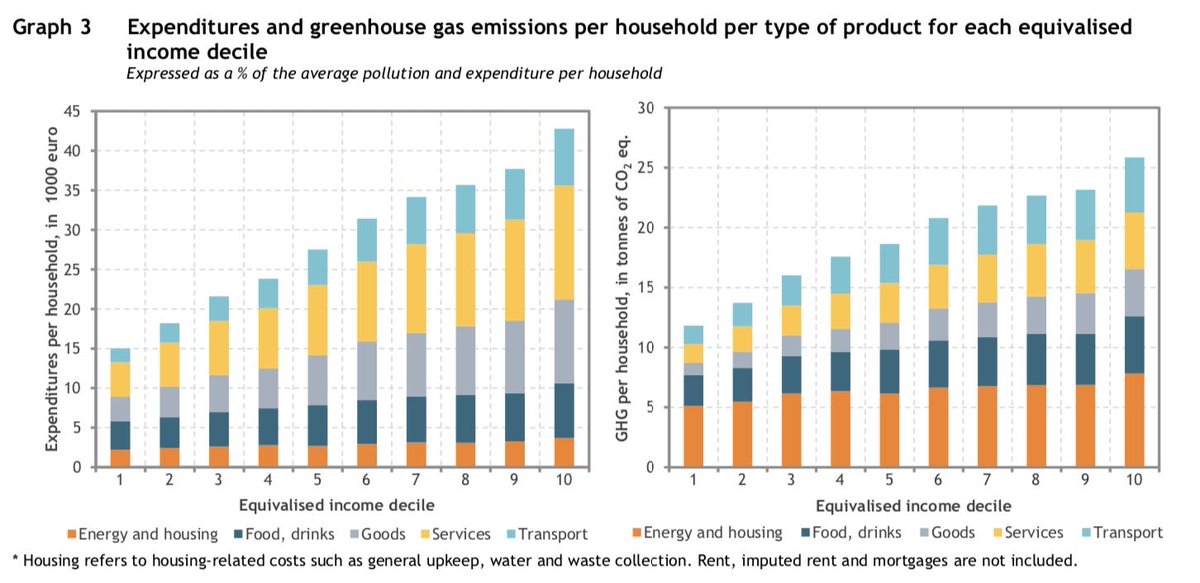
[4] Conclusion 1 : pollution per household increases considerably with income
* Energy/housing +- constant
* Mainly increase in goods, services and transport
* HH in poverty pollute less
* Energy/housing +- constant
* Mainly increase in goods, services and transport
* HH in poverty pollute less
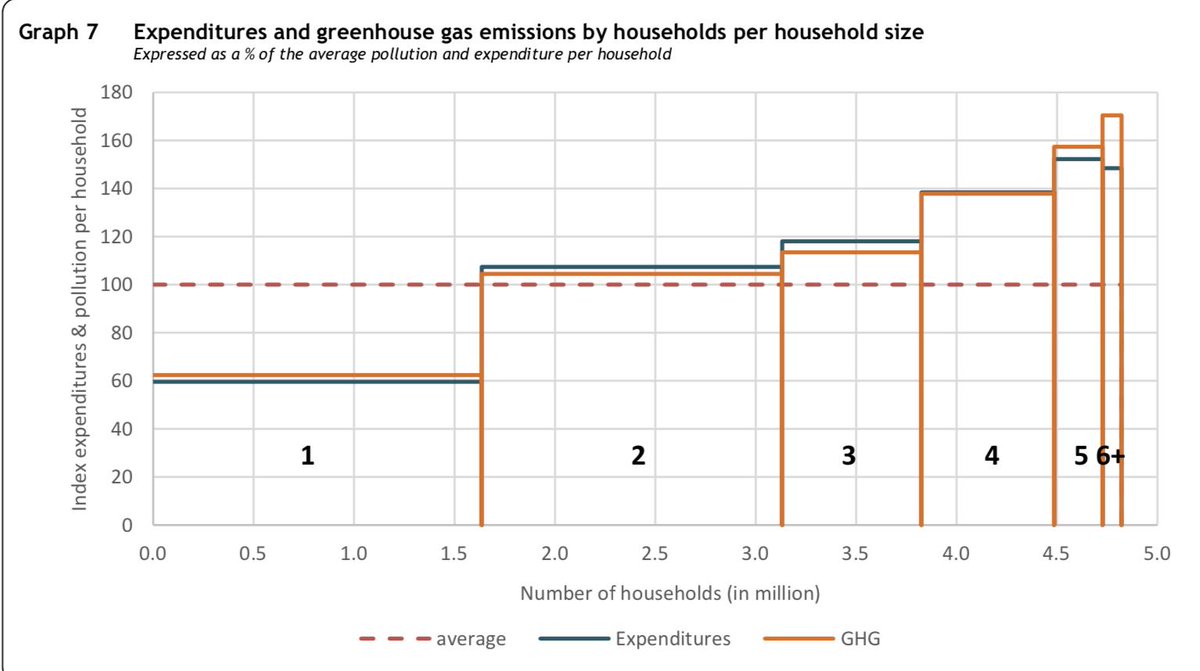
[5] Conclusion 2 : pollution increases less than proportionally with household size due to scale effects. Two and three person households have a lower than average per-capita emission level.
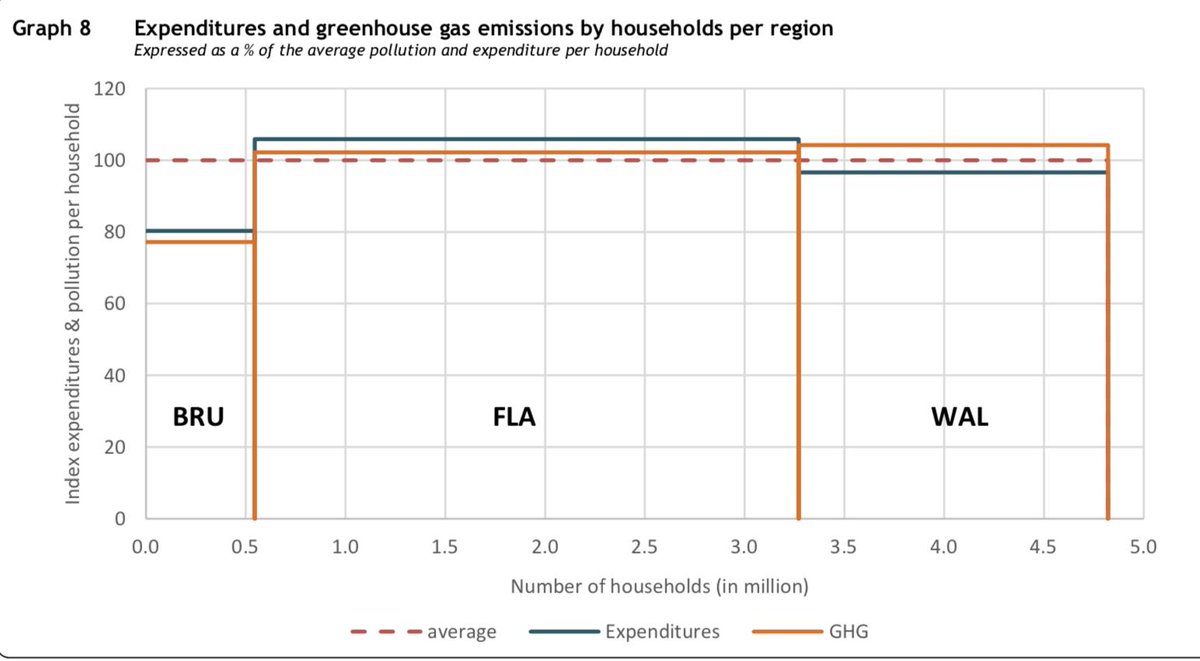
[6] Conclusion 3 : pollution per household slightly higher in Wallonia compared to Flanders. Level of pollution is considerably lower in Brussels.
Regional variable probably proxy for regional variations such as population density, housing stock, heating type, policy
Regional variable probably proxy for regional variations such as population density, housing stock, heating type, policy
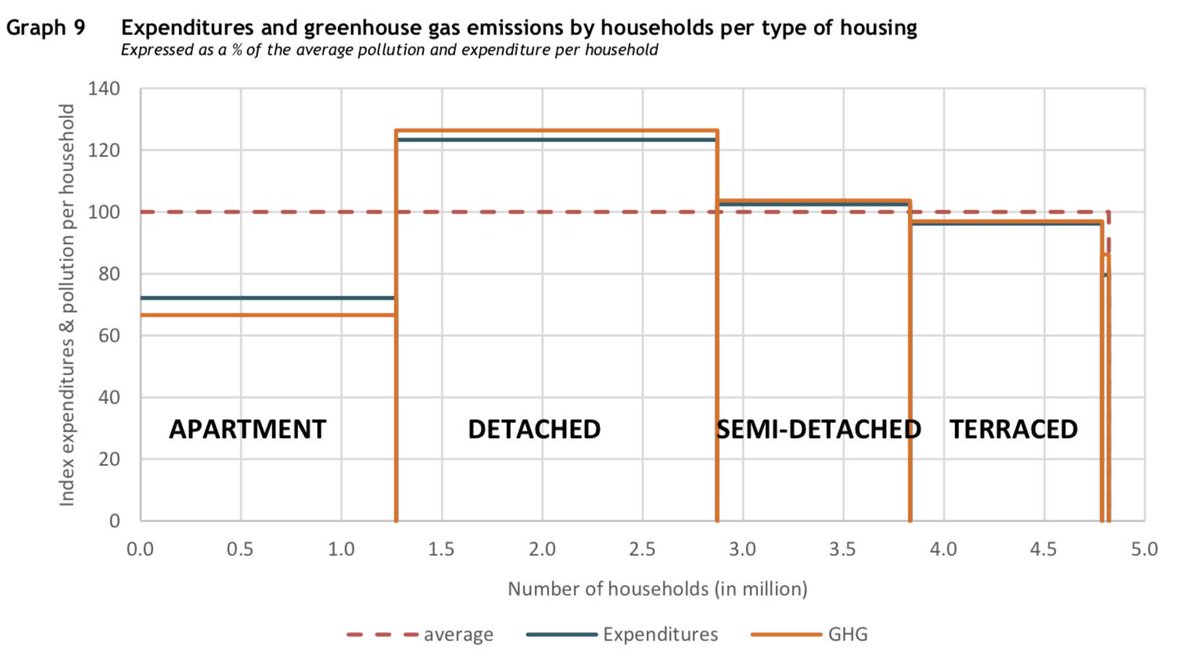
[7] Conclusion 4 : detached house emits 26 % more emissions than average. Apartment pollution little more than half of a detached house.