

@NASAEarth @NASAGoddard @moesgoi @rajeevan61 @jayashreenandi @VishnuNDTV @parthaabosu @airqualityindia @m_parrington @robertdfield @UrbanEmissions @iainmarlow @USRAedu @SmokeyBot @urbansciencesIN @avoiland @vinoj_iisc @jmccarty_geo This is an initial estimate based on 16-day Sep data from #Aqua #MODIS. I will revise it with monthly observations once they are available (likely in 2nd week of Oct), however not expecting major change in results.
@NASAEarth @NASAGoddard @moesgoi @rajeevan61 @jayashreenandi @VishnuNDTV @parthaabosu @airqualityindia @m_parrington @robertdfield @UrbanEmissions @iainmarlow @USRAedu @SmokeyBot @urbansciencesIN @avoiland @vinoj_iisc @jmccarty_geo Note that prediction is valid strictly under the traditional residue burning scenario. A departure from the estimates plus/minus ~1500 fires may be interpreted as failure (actual fires>estimates) or success (actual fires<estimates) of effective crop residue management efforts.
@NASAEarth @NASAGoddard @moesgoi @rajeevan61 @jayashreenandi @VishnuNDTV @parthaabosu @airqualityindia @m_parrington @robertdfield @UrbanEmissions @iainmarlow @USRAedu @SmokeyBot @urbansciencesIN @avoiland @vinoj_iisc @jmccarty_geo Extended rainy season in Sep has forced a delay in post-monsoon crop harvest across northern India and in Punjab province of Pakistan. This will have likely consequence later in the season leading to congestion of agricultural burning activity in late Oct-early Nov.
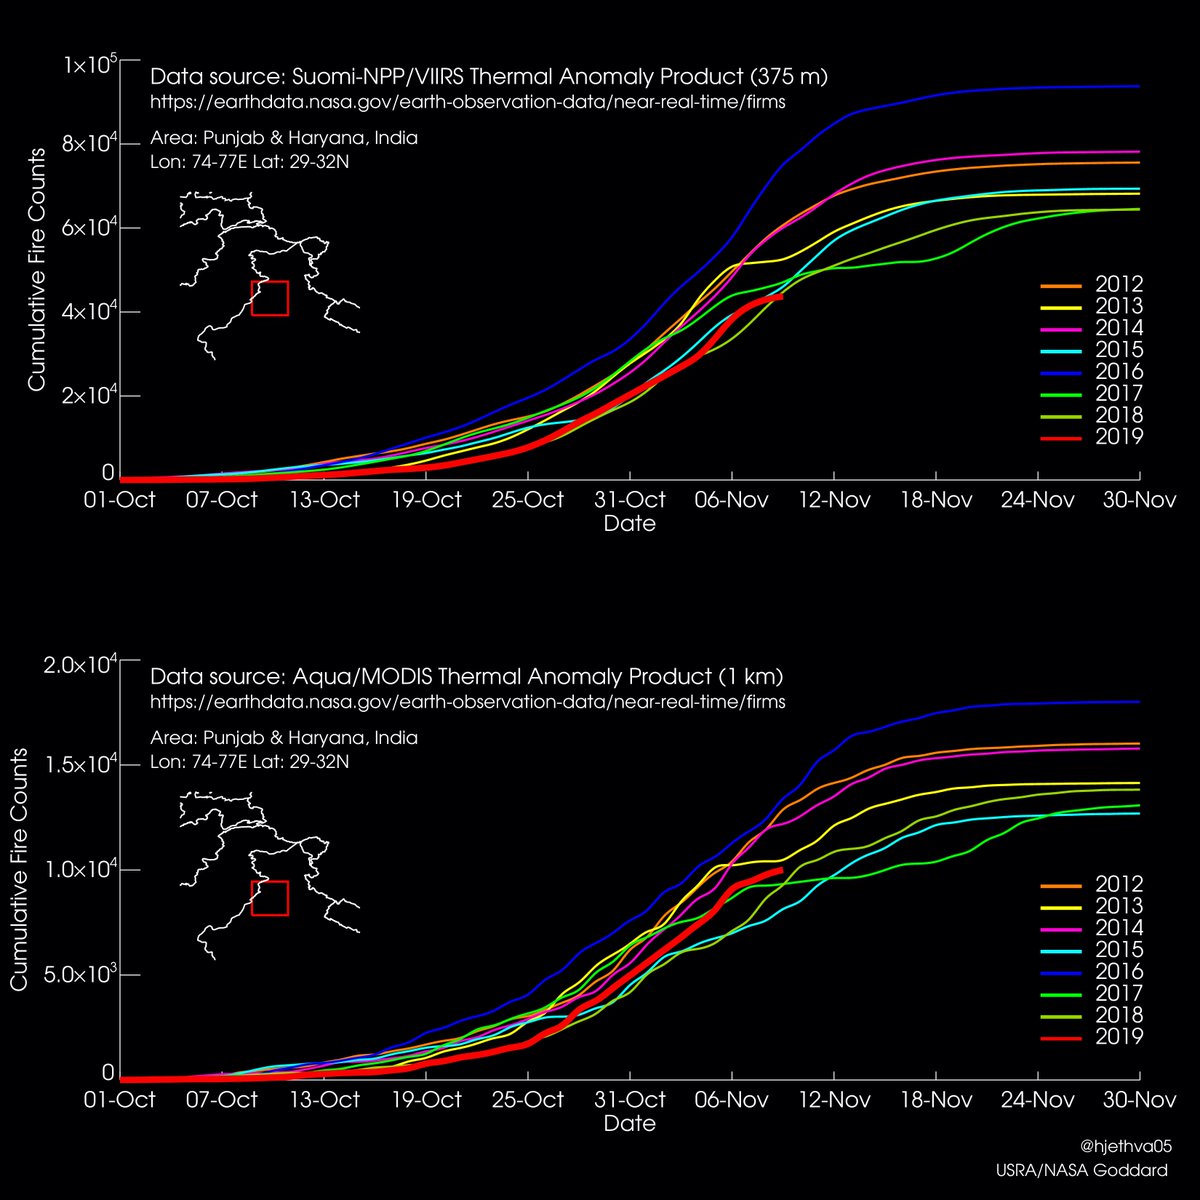
@NASAEarth @NASAGoddard @moesgoi @rajeevan61 @jayashreenandi @VishnuNDTV @parthaabosu @airqualityindia @m_parrington @robertdfield @UrbanEmissions @iainmarlow @USRAedu @SmokeyBot @urbansciencesIN @avoiland @vinoj_iisc @jmccarty_geo As of Oct 7th, the cumulative/total fire incidences detected by Aqua-MODIS and S-NPP-VIIRS is lowest in past 7 years (since 2012). Both, delayed rainy season and cloud cover hindering detection of fire spots are likely reasons for the quite start of the crop burning.
@NASAEarth @NASAGoddard @moesgoi @rajeevan61 @jayashreenandi @VishnuNDTV @parthaabosu @airqualityindia @m_parrington @robertdfield @UrbanEmissions @iainmarlow @USRAedu @SmokeyBot @urbansciencesIN @avoiland @vinoj_iisc @jmccarty_geo This is using VIIRS near-real time data
@NASAEarth @NASAGoddard @moesgoi @rajeevan61 @jayashreenandi @VishnuNDTV @parthaabosu @airqualityindia @m_parrington @robertdfield @UrbanEmissions @iainmarlow @USRAedu @SmokeyBot @urbansciencesIN @avoiland @vinoj_iisc @jmccarty_geo Oct 10th Update: Fire activity over Punjab-Haryana still at minimum, lowest in last 8 years. Hope it remains that way.
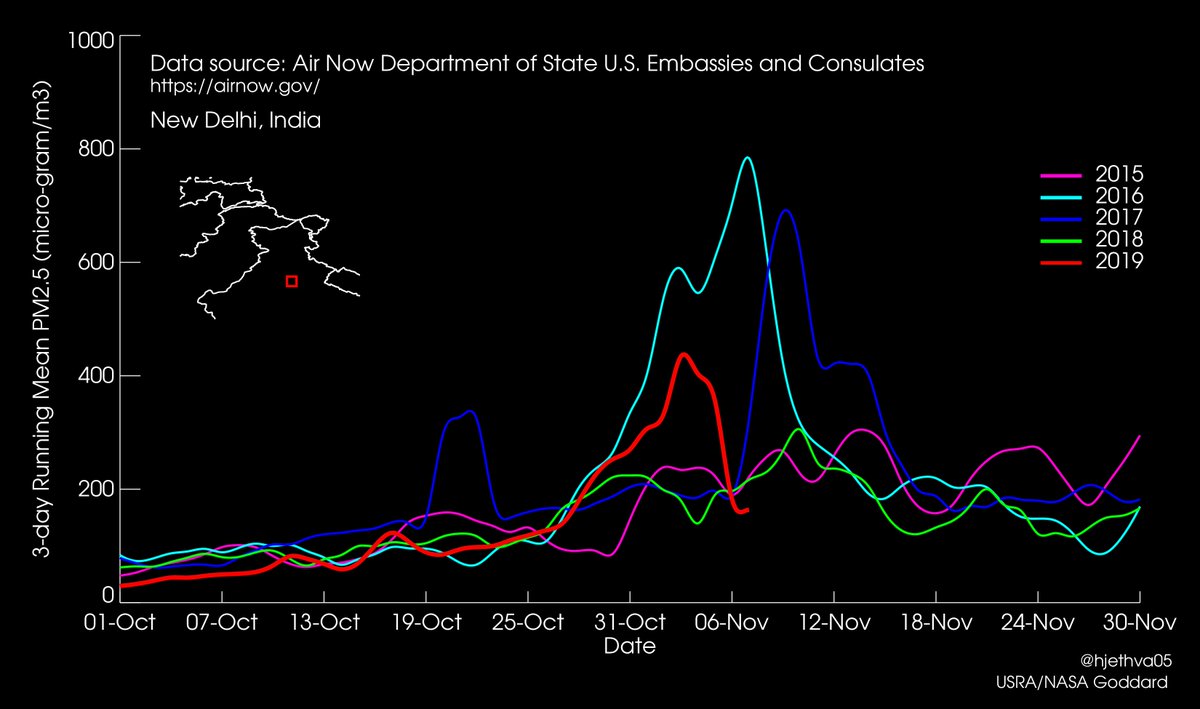
@NASAEarth @NASAGoddard @moesgoi @rajeevan61 @jayashreenandi @VishnuNDTV @parthaabosu @airqualityindia @m_parrington @robertdfield @UrbanEmissions @iainmarlow @USRAedu @SmokeyBot @urbansciencesIN @avoiland @vinoj_iisc @jmccarty_geo Half of October gone, fire activity is at minimum, comparable to that in 2013 and 2018. PM2.5 at the U.S. Embassy in New Delhi remains relatively lower but getting poorer as fires are picking up in northwest crop fields.
@NASAEarth @NASAGoddard @moesgoi @rajeevan61 @jayashreenandi @VishnuNDTV @parthaabosu @airqualityindia @m_parrington @robertdfield @UrbanEmissions @iainmarlow @USRAedu @SmokeyBot @urbansciencesIN @avoiland @vinoj_iisc @jmccarty_geo Significant changes in the greenness of crop fields pointing to a busy harvest season. Next two weeks would be judgmental to determine whether in-situ residue management a success or needs further boost.
@NASAEarth @NASAGoddard @moesgoi @rajeevan61 @jayashreenandi @VishnuNDTV @parthaabosu @airqualityindia @m_parrington @robertdfield @UrbanEmissions @iainmarlow @USRAedu @SmokeyBot @urbansciencesIN @avoiland @vinoj_iisc @jmccarty_geo The return of smog episodes over Indo-Gangetic Plain. Crop burning in northwest is picking up and comparable to that observed in 2018, so far. Animation: True-color images captured by Japanese #Himawari8 geostationary satellite.
@NASAEarth @NASAGoddard @moesgoi @rajeevan61 @jayashreenandi @VishnuNDTV @parthaabosu @airqualityindia @m_parrington @robertdfield @UrbanEmissions @iainmarlow @USRAedu @SmokeyBot @urbansciencesIN @avoiland @vinoj_iisc @jmccarty_geo Progression of fire season closely following the 2018 pattern. Today, Oct 26th, the cumulative fire counts just surpassed the 2018 mark. PM2.5 in New Delhi (the US Embassy) is now aligned with that recorded in 2016 and 2018. I hope it doesn’t take 2016 route.
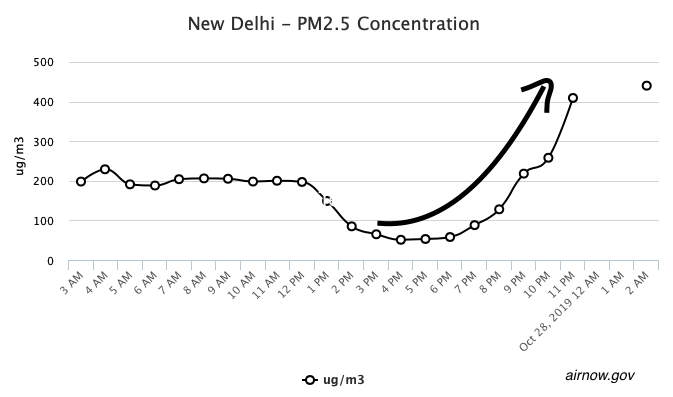
@NASAEarth @NASAGoddard @moesgoi @rajeevan61 @jayashreenandi @VishnuNDTV @parthaabosu @airqualityindia @m_parrington @robertdfield @UrbanEmissions @iainmarlow @USRAedu @SmokeyBot @urbansciencesIN @avoiland @vinoj_iisc @jmccarty_geo A low before high: PM2.5 at the US Embassy, New Delhi plunged to pre-crop burning period (~50 micro-g/m3) before climbing to >400 micro-g/m3 on Diwali night likely due to fireworks effect. 
@NASAEarth @NASAGoddard @moesgoi @rajeevan61 @jayashreenandi @VishnuNDTV @parthaabosu @airqualityindia @m_parrington @robertdfield @UrbanEmissions @iainmarlow @USRAedu @SmokeyBot @urbansciencesIN @avoiland @vinoj_iisc @jmccarty_geo Stubble burning on the rise, already crossed the 2015 and 2018 levels and expected to climb further. Done with Diwali fireworks but air quality in New Delhi (and rest in the region) worsening due to intense farm fires in northwest.

@NASAEarth @NASAGoddard @moesgoi @rajeevan61 @jayashreenandi @VishnuNDTV @parthaabosu @airqualityindia @m_parrington @robertdfield @UrbanEmissions @iainmarlow @USRAedu @SmokeyBot @urbansciencesIN @avoiland @vinoj_iisc @jmccarty_geo Oh dear! PM2.5 in New Delhi taking 2016 route-the worst in recent years. If it continues that way, we will likely see hazardous air quality leading to public health emergencies in coming days. I am worried.
@NASAEarth @NASAGoddard @moesgoi @rajeevan61 @jayashreenandi @VishnuNDTV @parthaabosu @airqualityindia @m_parrington @robertdfield @UrbanEmissions @iainmarlow @USRAedu @SmokeyBot @urbansciencesIN @avoiland @vinoj_iisc @jmccarty_geo The return of 2016: They say history repeats itself, this seems to be true for air pollution too. Today, Oct 31st, the patterns of smoke blanketing N India closely resemble the infamous 2016 episode of extremely poor air quality
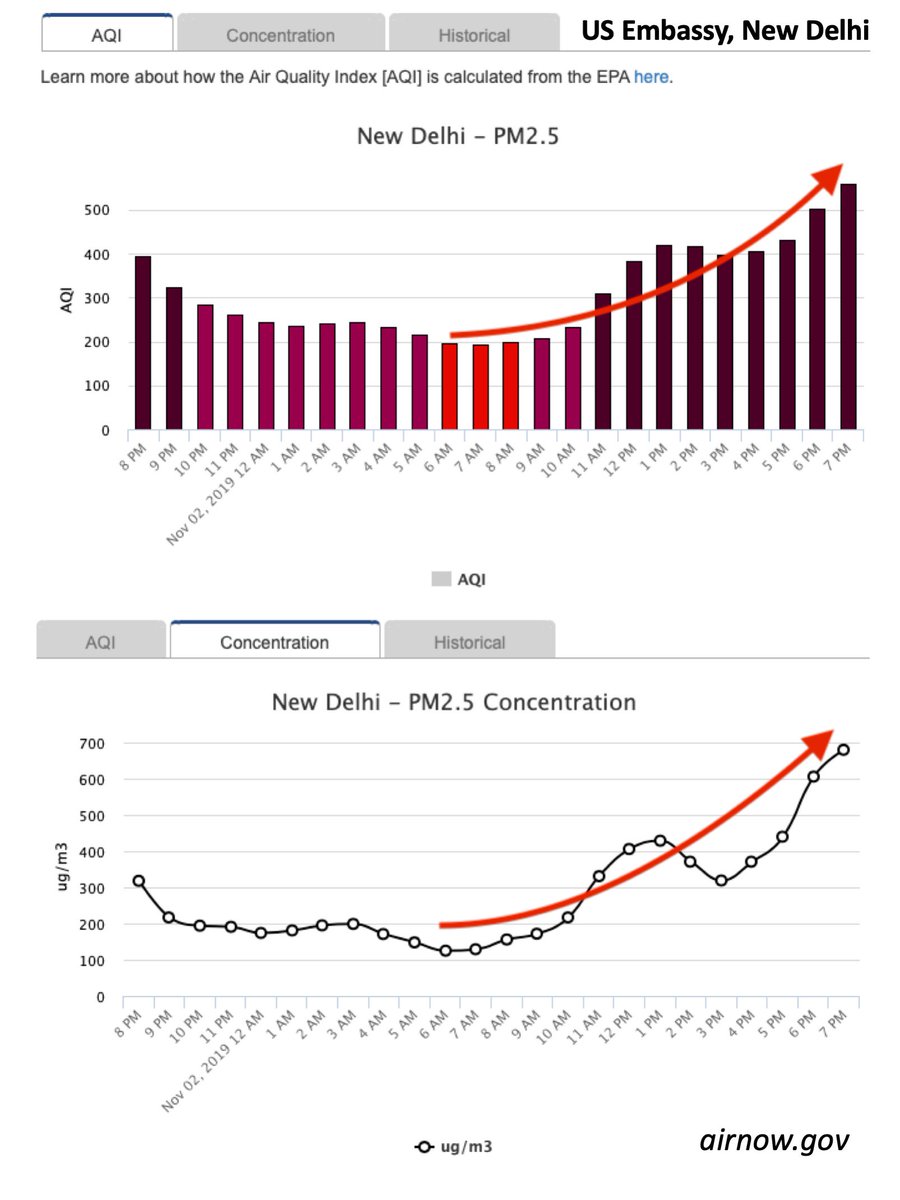
@NASAEarth @NASAGoddard @moesgoi @rajeevan61 @jayashreenandi @VishnuNDTV @parthaabosu @airqualityindia @m_parrington @robertdfield @UrbanEmissions @iainmarlow @USRAedu @SmokeyBot @urbansciencesIN @avoiland @vinoj_iisc @jmccarty_geo A dramatic fall and rise of air pollution in New Delhi recently have been remarkable and emphasizing the role of transport of burned stubble smoke and how winds clear it in a few hours. The WD has obstructed the view of fires but I assume it is nearing its peak activity
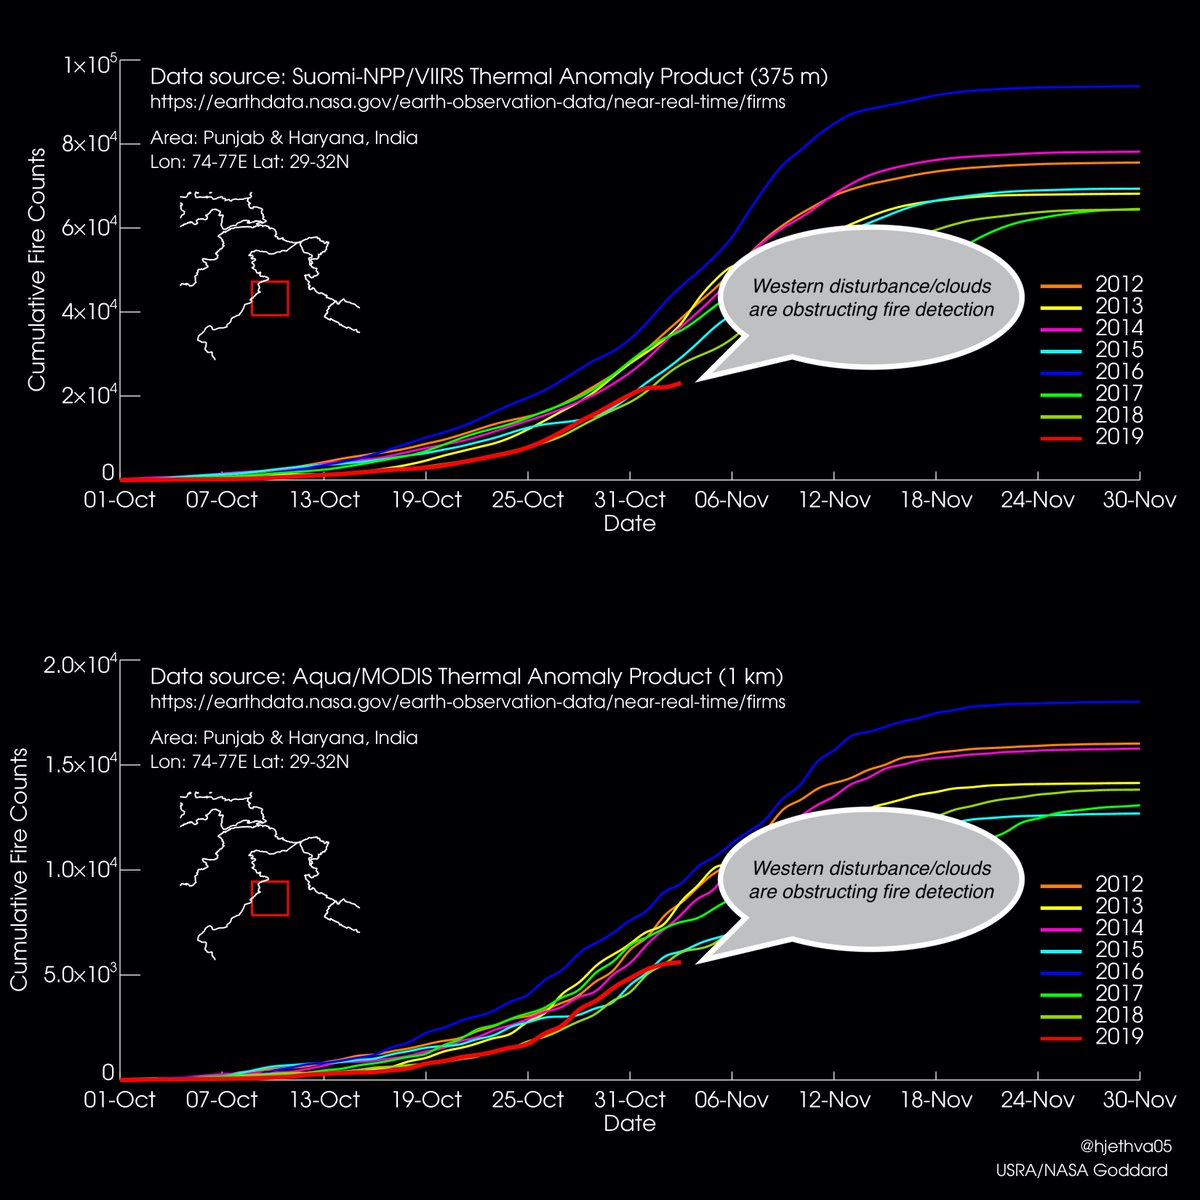
@NASAEarth @NASAGoddard @moesgoi @rajeevan61 @jayashreenandi @VishnuNDTV @parthaabosu @airqualityindia @m_parrington @robertdfield @UrbanEmissions @iainmarlow @USRAedu @SmokeyBot @urbansciencesIN @avoiland @vinoj_iisc @jmccarty_geo Don't mislead by a temporary stagnation of cumulative fire activity as WD/clouds are hindering the fire detection for last 3 days. Fires are presumably increasing at the steepest rate corroborated by extremely hazardous PM2.5 levels>1000 mu-g/m3 in Delhi
@NASAEarth @NASAGoddard @moesgoi @rajeevan61 @jayashreenandi @VishnuNDTV @parthaabosu @airqualityindia @m_parrington @robertdfield @UrbanEmissions @iainmarlow @USRAedu @SmokeyBot @urbansciencesIN @avoiland @vinoj_iisc @jmccarty_geo A striking diff between Terra (morning) and Aqua (afternoon) MODIS images showing fire hotspots in the afternoon hours (better burning conditions, lower RH). A fresh load of smoke (despite Supreme Court directives against burning) will likely degrade air quality downstream.
@NASAEarth @NASAGoddard @moesgoi @rajeevan61 @jayashreenandi @VishnuNDTV @parthaabosu @airqualityindia @m_parrington @robertdfield @UrbanEmissions @iainmarlow @USRAedu @SmokeyBot @urbansciencesIN @avoiland @vinoj_iisc @jmccarty_geo Haze Smothers Northern India - An Image Of The Day Article on NASA's Earth Observatory
earthobservatory.nasa.gov/images/145827/…
earthobservatory.nasa.gov/images/145827/…
@NASAEarth @NASAGoddard @moesgoi @rajeevan61 @jayashreenandi @VishnuNDTV @parthaabosu @airqualityindia @m_parrington @robertdfield @UrbanEmissions @iainmarlow @USRAedu @SmokeyBot @urbansciencesIN @avoiland @vinoj_iisc @jmccarty_geo Vegetation index and true-color RGB image, when compared to those of last year’s end-of-burning-season, indicate that a lot of stubble is yet to be burned/cleared in the coming days, particularly over central/southern Punjab. Image courtesy: NASA’s Worldview
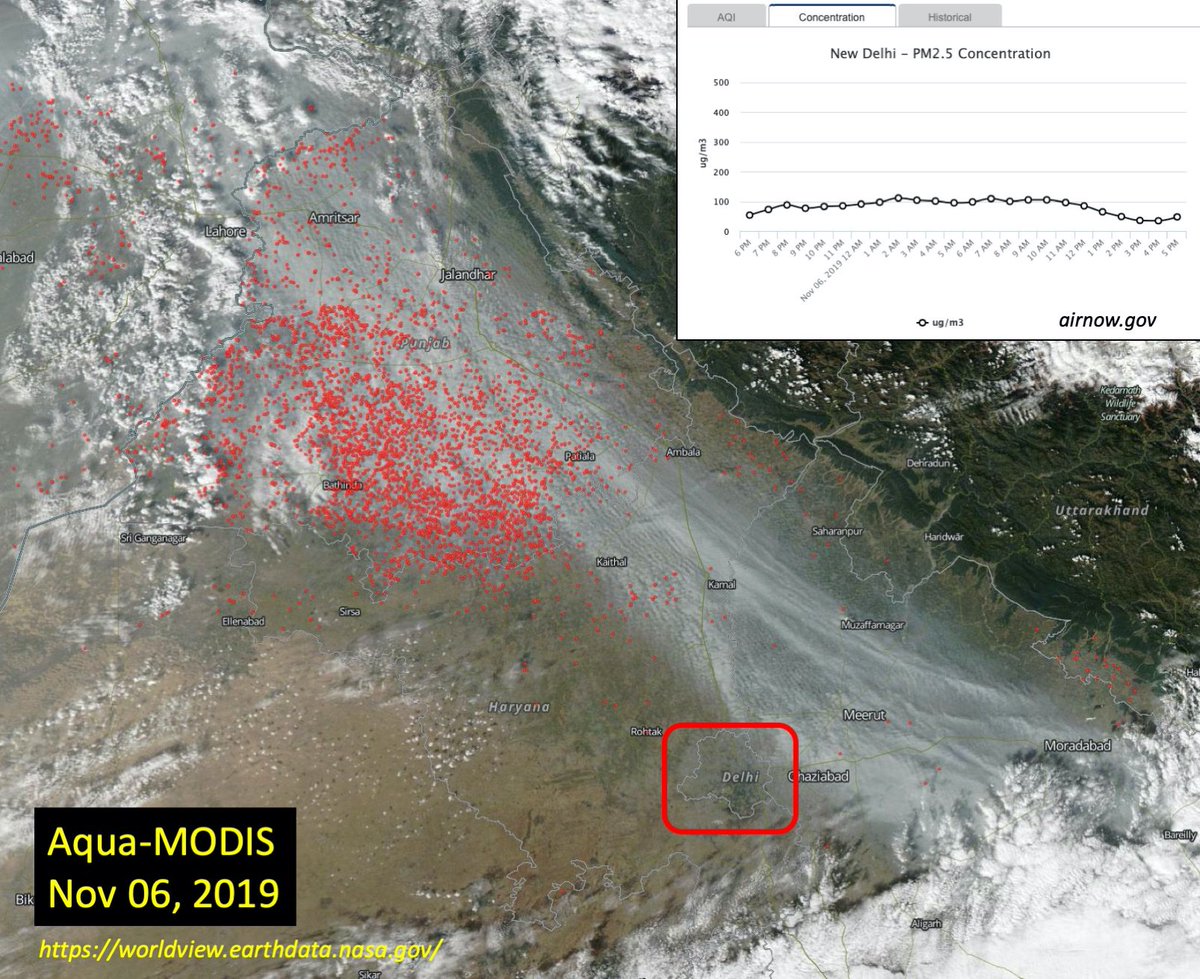
@NASAEarth @NASAGoddard @moesgoi @rajeevan61 @jayashreenandi @VishnuNDTV @parthaabosu @airqualityindia @m_parrington @robertdfield @UrbanEmissions @iainmarlow @USRAedu @SmokeyBot @urbansciencesIN @avoiland @vinoj_iisc @jmccarty_geo Delhi was lucky today to escape a fresh load of smoke from Punjab, thanks to a shift in wind direction. PM2.5 stayed relatively lower (~100 mu-g/m3) compared to hazardous levels seen in last few days.
@NASAEarth @NASAGoddard @moesgoi @rajeevan61 @jayashreenandi @VishnuNDTV @parthaabosu @airqualityindia @m_parrington @robertdfield @UrbanEmissions @iainmarlow @USRAedu @SmokeyBot @urbansciencesIN @avoiland @vinoj_iisc @jmccarty_geo Coming out very soon: Our latest paper in Scientific Reports. “Connecting Crop Productivity, Residue Fires, and Air Quality over Northern India”...Stay tuned!
@NASAEarth @NASAGoddard @moesgoi @rajeevan61 @jayashreenandi @VishnuNDTV @parthaabosu @airqualityindia @m_parrington @robertdfield @UrbanEmissions @iainmarlow @USRAedu @SmokeyBot @urbansciencesIN @avoiland @vinoj_iisc @jmccarty_geo #CycloneBulbul has forced the change in circulation pushing smoke pollution back to westward direction. AQ in Rajasthan and parts of MP/Gujarat is likely to be degraded.
@NASAEarth @NASAGoddard @moesgoi @rajeevan61 @jayashreenandi @VishnuNDTV @parthaabosu @airqualityindia @m_parrington @robertdfield @UrbanEmissions @iainmarlow @USRAedu @SmokeyBot @urbansciencesIN @avoiland @vinoj_iisc @jmccarty_geo A drastic drop in PM2.5 in New Delhi in last few days, thanks to reduced fire activity in Punjab and #CycloneBulbul for changing circulations, and also heard of some rain in the region washing out pollutants.
@NASAEarth @NASAGoddard @moesgoi @rajeevan61 @jayashreenandi @VishnuNDTV @parthaabosu @airqualityindia @m_parrington @robertdfield @UrbanEmissions @iainmarlow @USRAedu @SmokeyBot @urbansciencesIN @avoiland @vinoj_iisc @jmccarty_geo Our latest paper is out today in Scientific Reports. nature.com/articles/s4159….
Major findings:
1) rice production in Punjab has increased by 25%, and so has the vegetation index (NDVI) with a net increase of 21%
1/n
Major findings:
1) rice production in Punjab has increased by 25%, and so has the vegetation index (NDVI) with a net increase of 21%
1/n
@NASAEarth @NASAGoddard @moesgoi @rajeevan61 @jayashreenandi @VishnuNDTV @parthaabosu @airqualityindia @m_parrington @robertdfield @UrbanEmissions @iainmarlow @USRAedu @SmokeyBot @urbansciencesIN @avoiland @vinoj_iisc @jmccarty_geo 2) post-harvest agricultural fire activity has increased by net ~60% leading to nearly 43% increase in aerosol loading over the populous Indo-Gangetic Plain in northern India.
3) ground-level PM2.5 downwind in New Delhi shows a concurrent uptrend of net 60%
2/n
3) ground-level PM2.5 downwind in New Delhi shows a concurrent uptrend of net 60%
2/n
@NASAEarth @NASAGoddard @moesgoi @rajeevan61 @jayashreenandi @VishnuNDTV @parthaabosu @airqualityindia @m_parrington @robertdfield @UrbanEmissions @iainmarlow @USRAedu @SmokeyBot @urbansciencesIN @avoiland @vinoj_iisc @jmccarty_geo 4) A robust relationship between vegetation index—a proxy for the crop productivity, and post-harvest accumulated fire activity—a precursor of poor air quality, allows the prediction of the intensity of crop fire season and the resulting degradation of air quality in advance
3/n
3/n
@NASAEarth @NASAGoddard @moesgoi @rajeevan61 @jayashreenandi @VishnuNDTV @parthaabosu @airqualityindia @m_parrington @robertdfield @UrbanEmissions @iainmarlow @USRAedu @SmokeyBot @urbansciencesIN @avoiland @vinoj_iisc @jmccarty_geo 5) aerosol optical depth over IGP has increased at steepest rate (~0.02/year) during stubble burning months (Oct & Nov) followed by trends in winter (DJF) ~0.017/year, indicating that rice stubble fires is a leading cause of degrading AQ in region


