Case #2. Analysis #Endo International PLC (ENDP)
This company has had a very good 15 years but the last 4 years have proved miserable for buyers. The charts say it all - in 2019 we've seen all new time lows and the future does not look bright. ENDP shares the same fate as ...
This company has had a very good 15 years but the last 4 years have proved miserable for buyers. The charts say it all - in 2019 we've seen all new time lows and the future does not look bright. ENDP shares the same fate as ...
... other #opioid companies. I personally wouldn't touch this stock unless it broke the upside substantially. Healthcare stocks have been performing badly for most of 2019 - there are much more attractive stocks in other sectors. ...
... Sure the price might rise a little - but, what's the point of tying up capital when it could be used more efficiently elsewhere?!
Chart 1
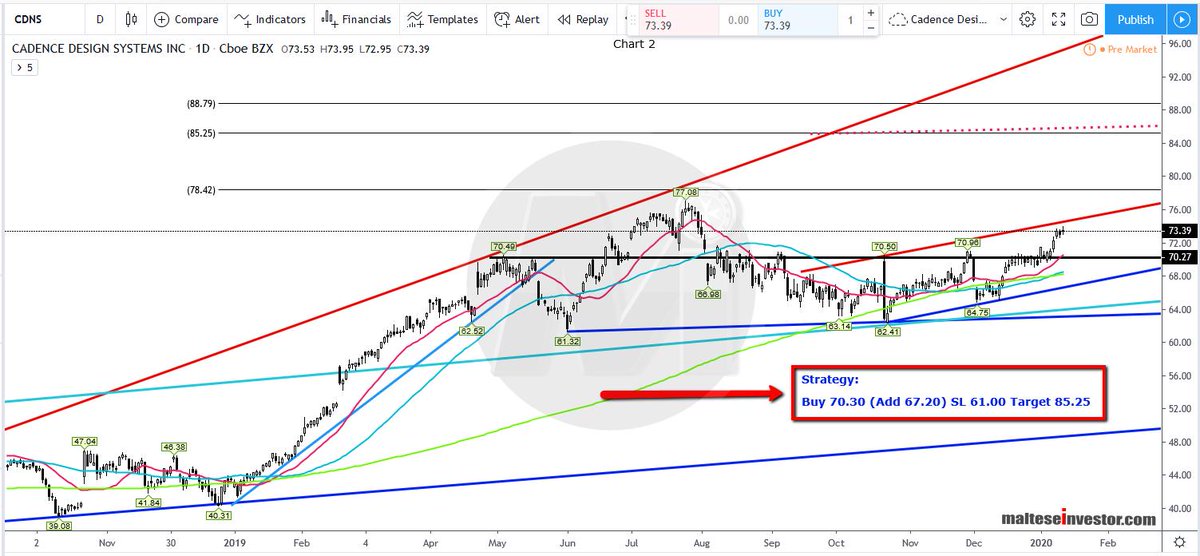
The monthly chart paints an awful picture. This #stock doesn't behave with technicals, the monthly pivots appear the most precise. The trendline pivot at approximately $26.19 remains an important resistance point, the longer it stays below the more the upside slope grows.
The monthly chart paints an awful picture. This #stock doesn't behave with technicals, the monthly pivots appear the most precise. The trendline pivot at approximately $26.19 remains an important resistance point, the longer it stays below the more the upside slope grows.
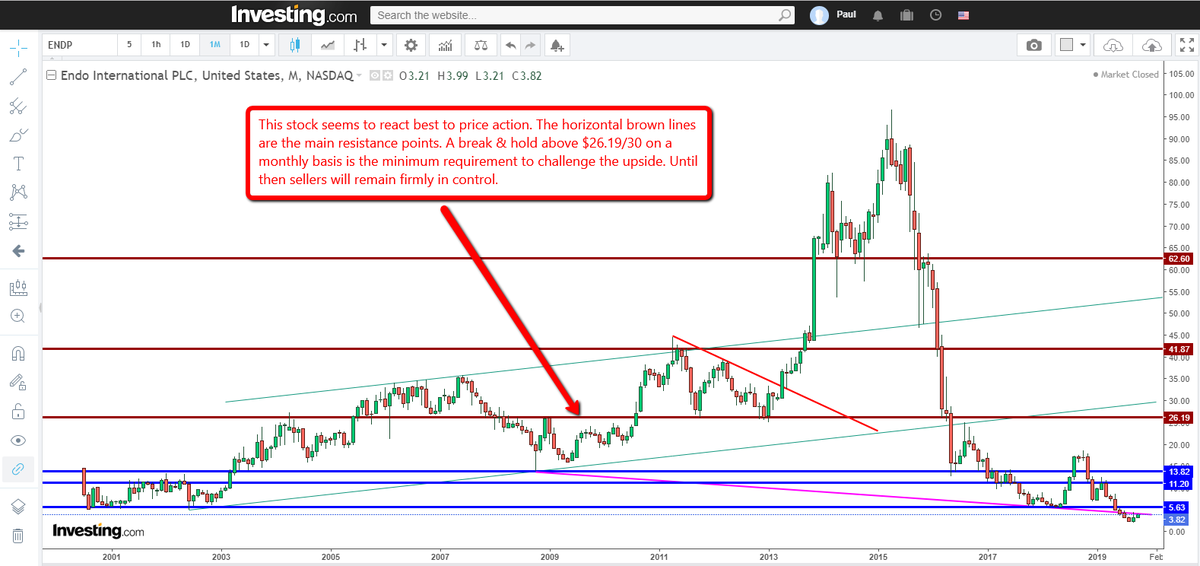
Chart 2
Again the monthly chart showing the effectiveness of the horizontal #pivots - breaking above/below.
Again the monthly chart showing the effectiveness of the horizontal #pivots - breaking above/below.
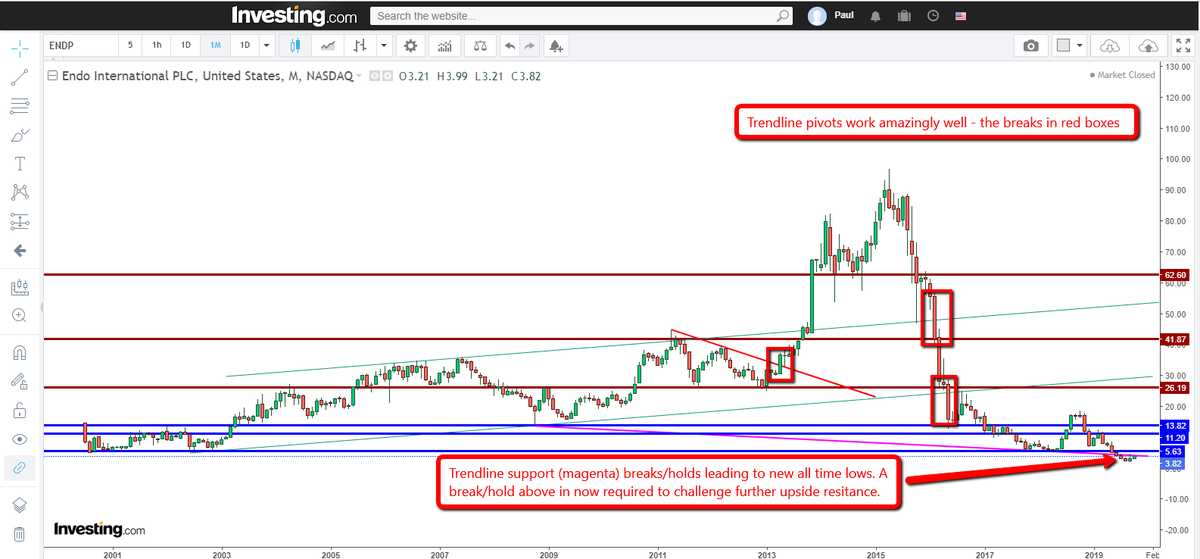
Chart 3
The daily chart. The monthly pivots have now been erased - but the #trendline support pivot is still visible.
The daily chart. The monthly pivots have now been erased - but the #trendline support pivot is still visible.
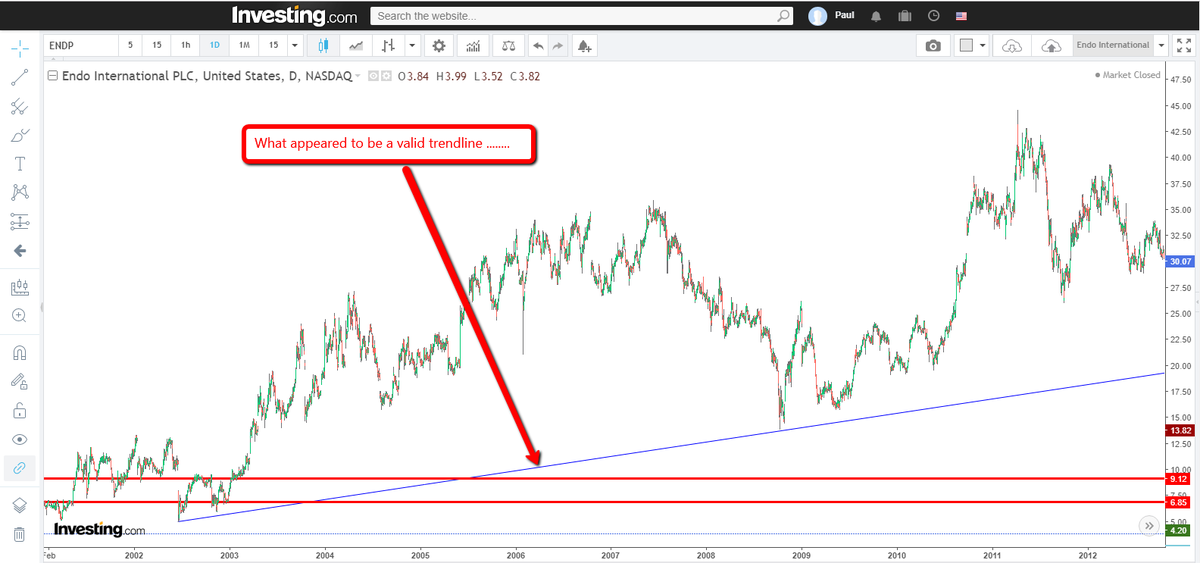
Chart 4
The trendline has failed and a trendline pivot has formed. Price has gapped below the now invalid trendline.
The downtrend is very strong, the horizontal pivots add temporary support and eventually price eases lower.
The trendline has failed and a trendline pivot has formed. Price has gapped below the now invalid trendline.
The downtrend is very strong, the horizontal pivots add temporary support and eventually price eases lower.

Chart 5
The pivots reacting well, except the brown pivot line - it got blown apart as price gapped above. But the gap will be filled in time.
The pivots reacting well, except the brown pivot line - it got blown apart as price gapped above. But the gap will be filled in time.

Chart 6
After 3 months the gap is filled. Price rises again to continue the most recent trend, but the long term trend is down and this time brown pivot comes nicely into play as price fails to trade back above.
After 3 months the gap is filled. Price rises again to continue the most recent trend, but the long term trend is down and this time brown pivot comes nicely into play as price fails to trade back above.
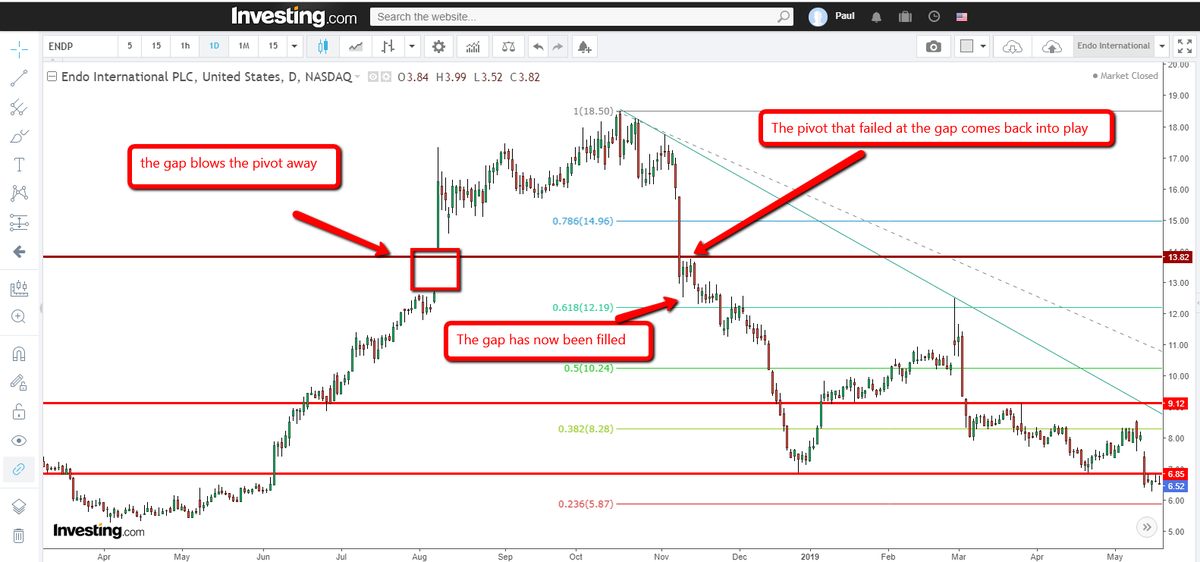
Chart 7
Fibs are added from 2018 high to 2019 low (the new all time low). A new pivot resistance and pivot support are added. A daily close below the $2.18 pivot could see prices drift further down. I wouldn't be surprised to see a new low form at $1.65/1.55 if $2.18 fails.
Fibs are added from 2018 high to 2019 low (the new all time low). A new pivot resistance and pivot support are added. A daily close below the $2.18 pivot could see prices drift further down. I wouldn't be surprised to see a new low form at $1.65/1.55 if $2.18 fails.

Chart 8
Price has never been above the 100 SMA for the whole of 2019, but will we see a break above ............ soon?
Price has never been above the 100 SMA for the whole of 2019, but will we see a break above ............ soon?