Are some days better than others for trading @bitcoin and other #crypto?
If so, how does trading $BTC only on (historically) the best days compare to simply #HODLing?
Check out our full analysis here! tinyurl.com/y6z55ulw
[explanation continued in comments]
If so, how does trading $BTC only on (historically) the best days compare to simply #HODLing?
Check out our full analysis here! tinyurl.com/y6z55ulw
[explanation continued in comments]

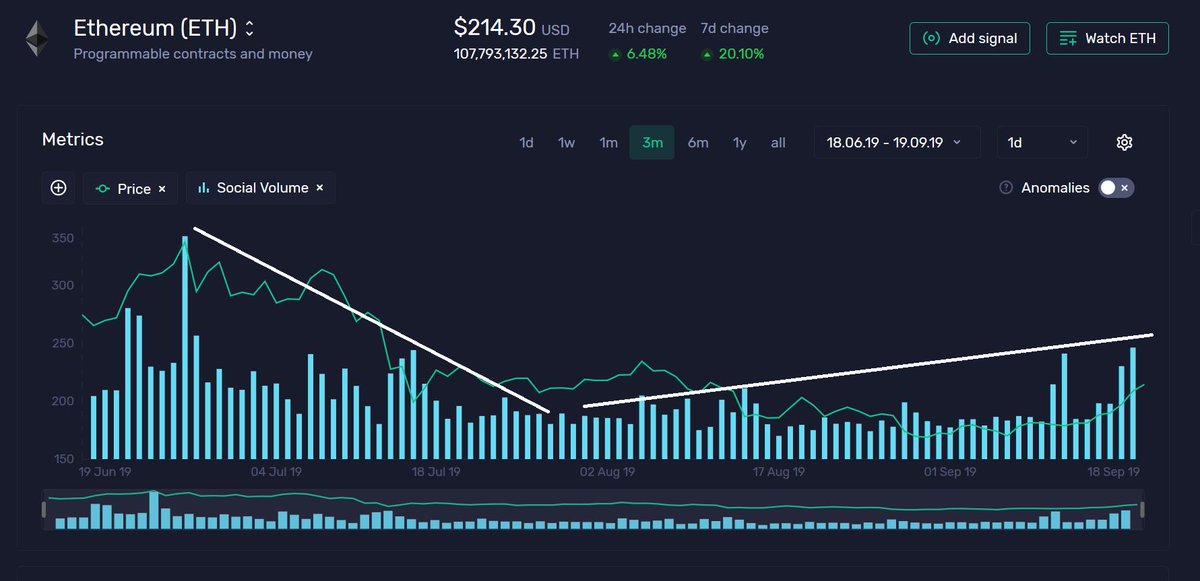
2/ To answer the above, we started by calculating the average $BTC price returns for each day of the week, including weekends.
Here are the average log returns for Bitcoin from 2017 until present day:
Here are the average log returns for Bitcoin from 2017 until present day:

3/ We can see major differences between days:
Monday and Saturday emerge as clear winners, with average returns of +0.69% and +0.5%, respectively.
Wednesday, Thursday and Sunday all returned neg. values for the past 2 years. To date, Weds proved to be the worst performing day.
Monday and Saturday emerge as clear winners, with average returns of +0.69% and +0.5%, respectively.
Wednesday, Thursday and Sunday all returned neg. values for the past 2 years. To date, Weds proved to be the worst performing day.
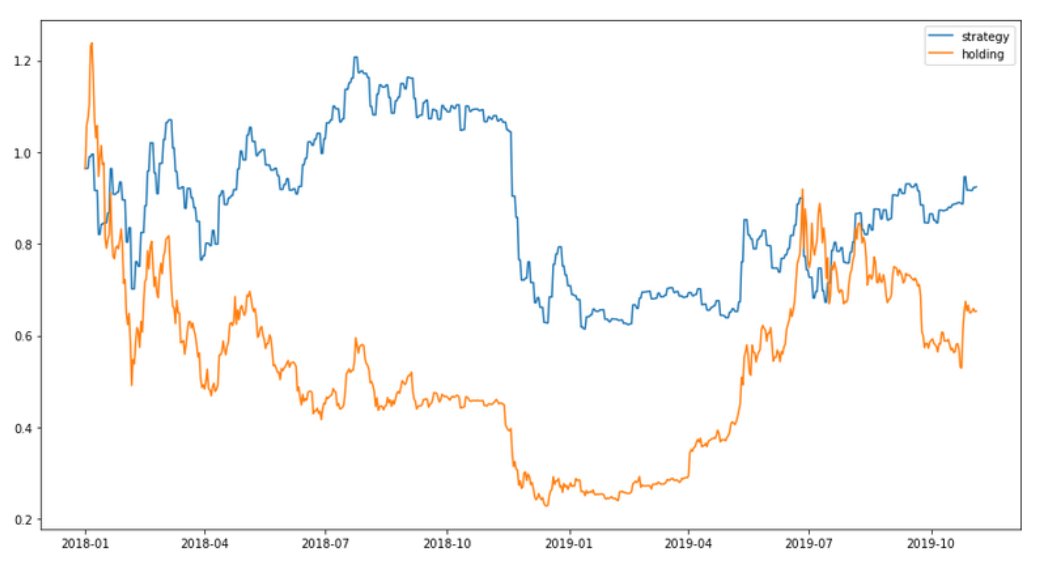
4/ With this info, we can now try and backtest a day-sensitive $BTC strategy.
Here’s how our $BTC portfolio would have performed if - starting in 2018 - we only bought @Bitcoin on Mondays and Saturdays and sold at the end of the day:
Here’s how our $BTC portfolio would have performed if - starting in 2018 - we only bought @Bitcoin on Mondays and Saturdays and sold at the end of the day:
5/ In this time frame, our strategy would pocket us a cool 68% profit, while HODLing #Bitcoin results in a 38% loss.
Unfortunately for our model, the infamous drop at the end of 2018 happened to be on a Monday, making the comparison a bit tighter than it would’ve been otherwise.
Unfortunately for our model, the infamous drop at the end of 2018 happened to be on a Monday, making the comparison a bit tighter than it would’ve been otherwise.
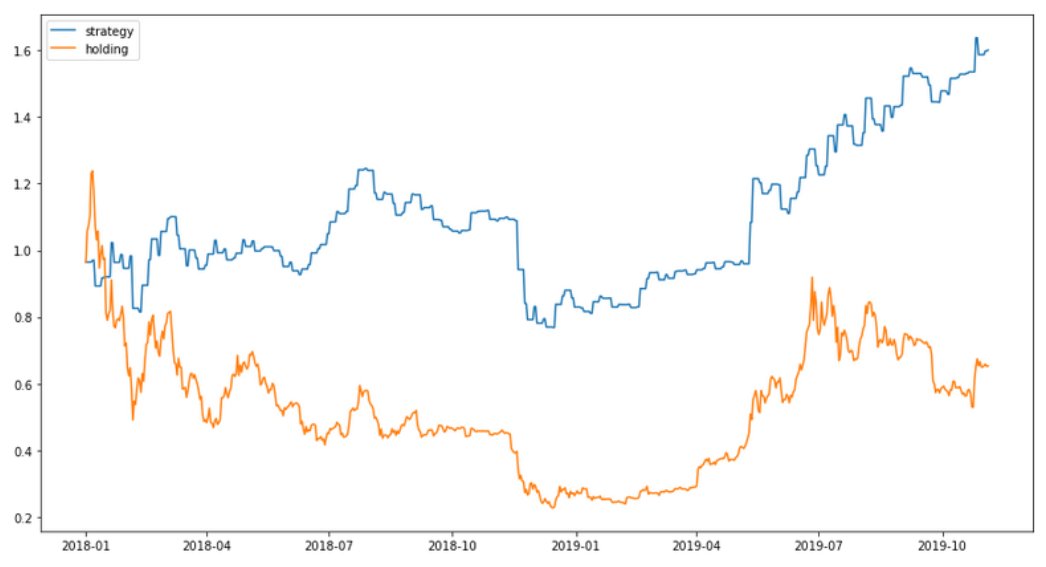
6/ Looking further in the past provides interesting results as well.
Backtesting the same day strategy, only this time from 2017 onwards, gives the following outcome:
Backtesting the same day strategy, only this time from 2017 onwards, gives the following outcome:

9/ The annualized standard deviation of our day strategy for the observed time frame was 0.43; for holding it was 0.84.
Annualized Sharpe ratio of our strategy was 1.65; for holding, it was 1.35
The strategy reduced volatility substantially and improved risk-adjusted returns.
Annualized Sharpe ratio of our strategy was 1.65; for holding, it was 1.35
The strategy reduced volatility substantially and improved risk-adjusted returns.
10/ So far, however, these backtests are riddled with hindsight bias. (investopedia.com/terms/h/hindsi…)
To eliminate it, instead of testing our day strategy back, let’s try and test it ‘forward’ - starting in 2018, and using data from the previous 2 years (2016-2018)
To eliminate it, instead of testing our day strategy back, let’s try and test it ‘forward’ - starting in 2018, and using data from the previous 2 years (2016-2018)
11/ Below are the 2016-17 average log returns for Bitcoin.
We actually get similar outputs to before, if you consider $BTC’s bullish tendencies throughout 2016.
The best performers are again Monday, Thursday and Saturday. Wednesday & Sunday are now also returning + values.
We actually get similar outputs to before, if you consider $BTC’s bullish tendencies throughout 2016.
The best performers are again Monday, Thursday and Saturday. Wednesday & Sunday are now also returning + values.

12/ With this info back in 2018, we might have decided to trade #Bitcoin only on Mondays, Thursdays and Saturdays - and sell at the end of each.
Here are the results of that day strategy from January 2018 onwards:
Here are the results of that day strategy from January 2018 onwards:
14/ However, while #BTC is a decent proxy for market, the best days might be different for other coins
That’s why we created a ‘daily performance’ template, where you can find the best trading days for any coin in the Santiment database - docs.google.com/spreadsheets/d…
That’s why we created a ‘daily performance’ template, where you can find the best trading days for any coin in the Santiment database - docs.google.com/spreadsheets/d…
15/ Download the #Sansheets plugin (sheets.santiment.net) so you can import #Santiment data into Google Spreadsheets, then use this pre-made template to understand which days have had the best historical returns for any coin.
16/ One big caveat - this analysis doesn’t take into account one obvious downside of any active trading strategy - transaction costs.
Those costs would chip away at the projected returns, narrowing the gap between the outlined strategy and our benchmark in reality.
Those costs would chip away at the projected returns, narrowing the gap between the outlined strategy and our benchmark in reality.
17/ Trading on specific days is obviously not the holy grail of strategies. Rather, it's complementary to other models.
If you’re already an active trader, it could help offset some of #crypto’s volatility, and warn you of days when odds have been stacked against in the past.
If you’re already an active trader, it could help offset some of #crypto’s volatility, and warn you of days when odds have been stacked against in the past.
18/ Read the full analysis here, and please note that this is NOT financial advice. tinyurl.com/y6z55ulw