Analysis: #NYSE $IBM
Case 116 #International_Business_Machines Corporation
DISCLAIMER: The analysis is strictly for educational purposes and should not be construed as an invitation to trade.
Thread 👇👇👇
#IBM 1/4
Case 116 #International_Business_Machines Corporation
DISCLAIMER: The analysis is strictly for educational purposes and should not be construed as an invitation to trade.
Thread 👇👇👇
#IBM 1/4

Chart 1
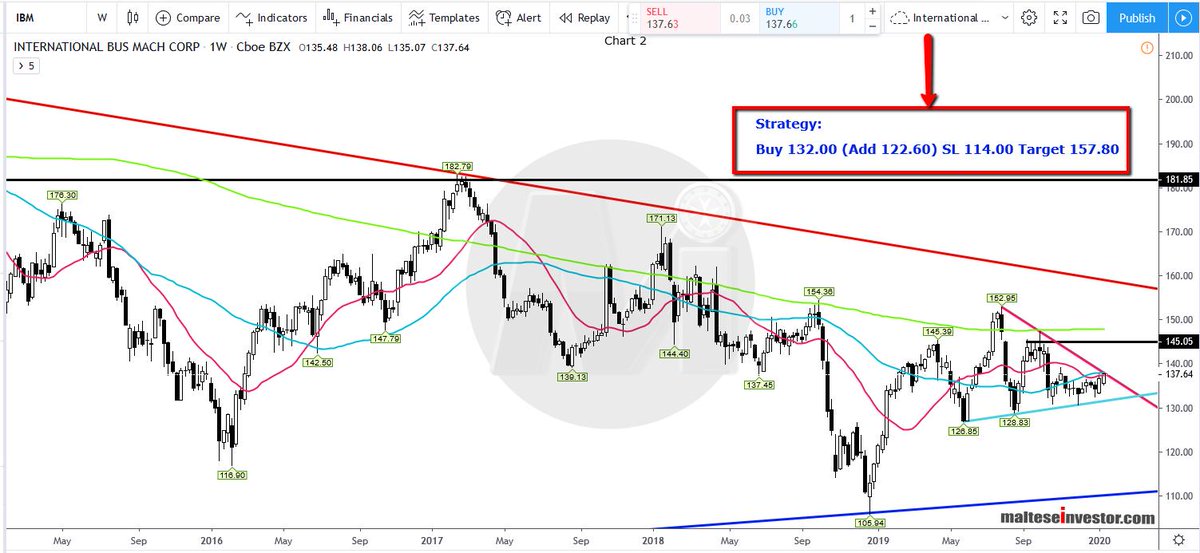
Monthly Chart: Ever since peaking at 215.90 in March 2013, IBM has lost half its value but found #support on the 26 year #trendline. #Resistances above are tough and upside moves are quickly stifled by .....
IBM 2/4
Monthly Chart: Ever since peaking at 215.90 in March 2013, IBM has lost half its value but found #support on the 26 year #trendline. #Resistances above are tough and upside moves are quickly stifled by .....
IBM 2/4
..... heavy selling. We expect the broad two way action range play to continue for the next couple of years.
IBM 3/4
IBM 3/4