My Authors
Read all threads
Analysis: #NYSE $VMW

Case 209 #VMware Inc.

DISCLAIMER: The analysis is strictly for educational purposes and should not be construed as an invitation to trade.

#VMW 1/4
Chart 1
Weekly Chart: Since registering the all time high of 206.80 (May 2019) price has fallen way back below the old trading range 167.20-19.30 and the #SMA 200 126.16 - the stock is now very #bearish on .....

VMW 2/4
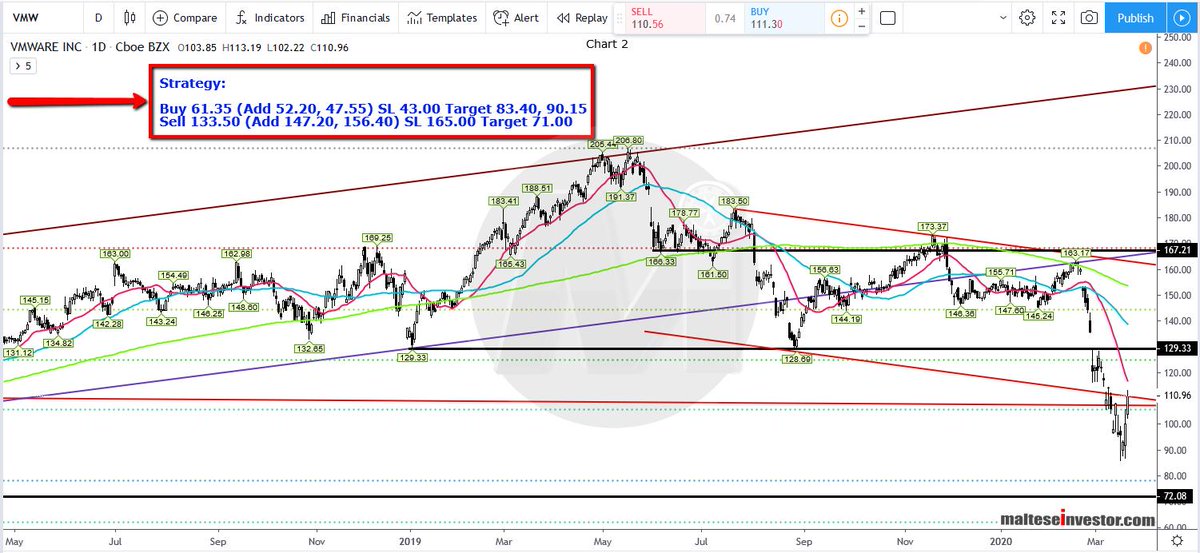
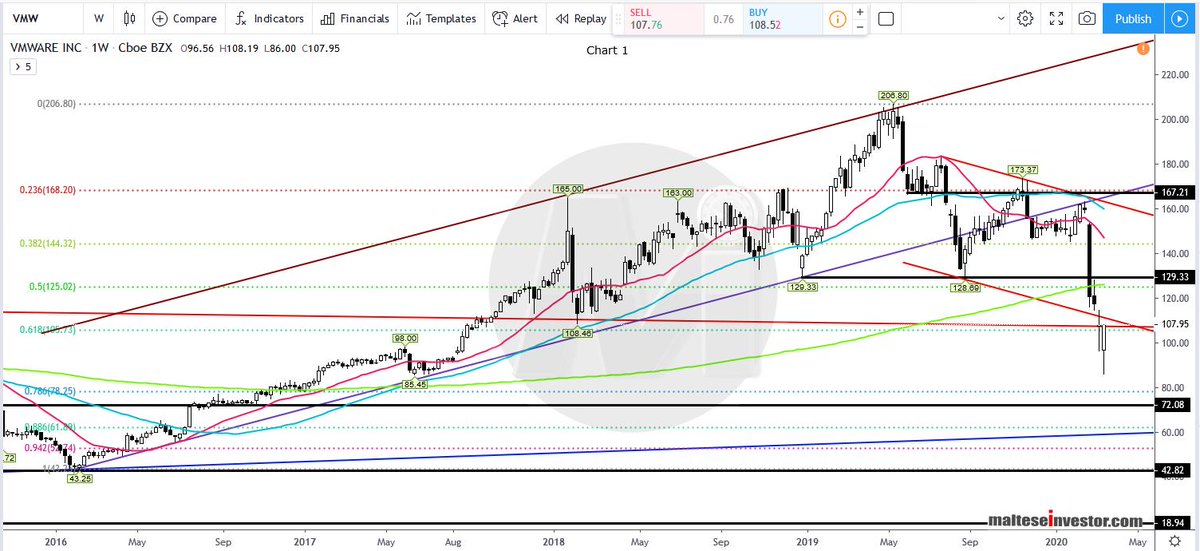
..... the short and long term. The #resistance zone 147.40-168.80 is now very formidable and we expect prices to trade lower and head towards #support at 72.10 - 65.50 within the next 8 months.

VMW 3/4
Chart 2
Daily Chart: The #Strategy is printed on the image.

$VMW 4/4
Missing some Tweet in this thread? You can try to force a refresh.

Enjoying this thread?

Keep Current with malteseinvestor

Profile picture

Stay in touch and get notified when new unrolls are available from this author!

Read all threads

This Thread may be Removed Anytime!

Twitter may remove this content at anytime, convert it as a PDF, save and print for later use!

Try unrolling a thread yourself!

how to unroll video

1) Follow Thread Reader App on Twitter so you can easily mention us!

2) Go to a Twitter thread (series of Tweets by the same owner) and mention us with a keyword "unroll" @threadreaderapp unroll

You can practice here first or read more on our help page!

Follow Us on Twitter!

Did Thread Reader help you today?

Support us! We are indie developers!


This site is made by just three indie developers on a laptop doing marketing, support and development! Read more about the story.

Become a Premium Member ($3.00/month or $30.00/year) and get exclusive features!

Become Premium

Too expensive? Make a small donation by buying us coffee ($5) or help with server cost ($10)

Donate via Paypal Become our Patreon

Thank you for your support!