1/n COVID-19: As of TODAY, data analysis shows that the U.S. response is set to have the same or worse outcomes than that of China. Below, a THREAD on comparing national outbreak trends and response effectiveness via logarithmic scale charts. (Chart source: @FT). 
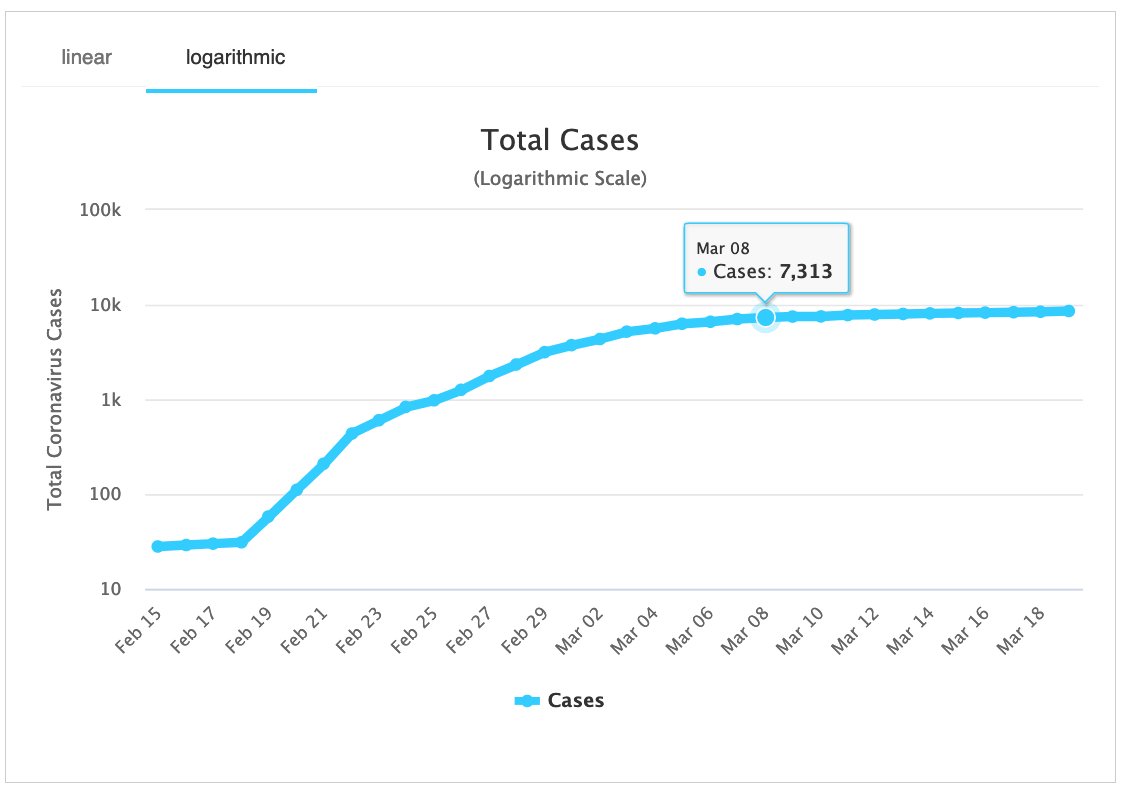
2/n Logarithmic scale charts are better at displaying trends, esp. for exponential data as is the case with virus spread. Example below shows how an exponential increase looks like a curve w/ an increasing slope on the linear scale, but a linear trend on the logarithmic scale.

3/n Virus cases from the U.S. have grown exponentially (linear scale chart below). But when did the exponential trend start, and when will it end?
(Source: worldometers.info/coronavirus/co…)
(Source: worldometers.info/coronavirus/co…)
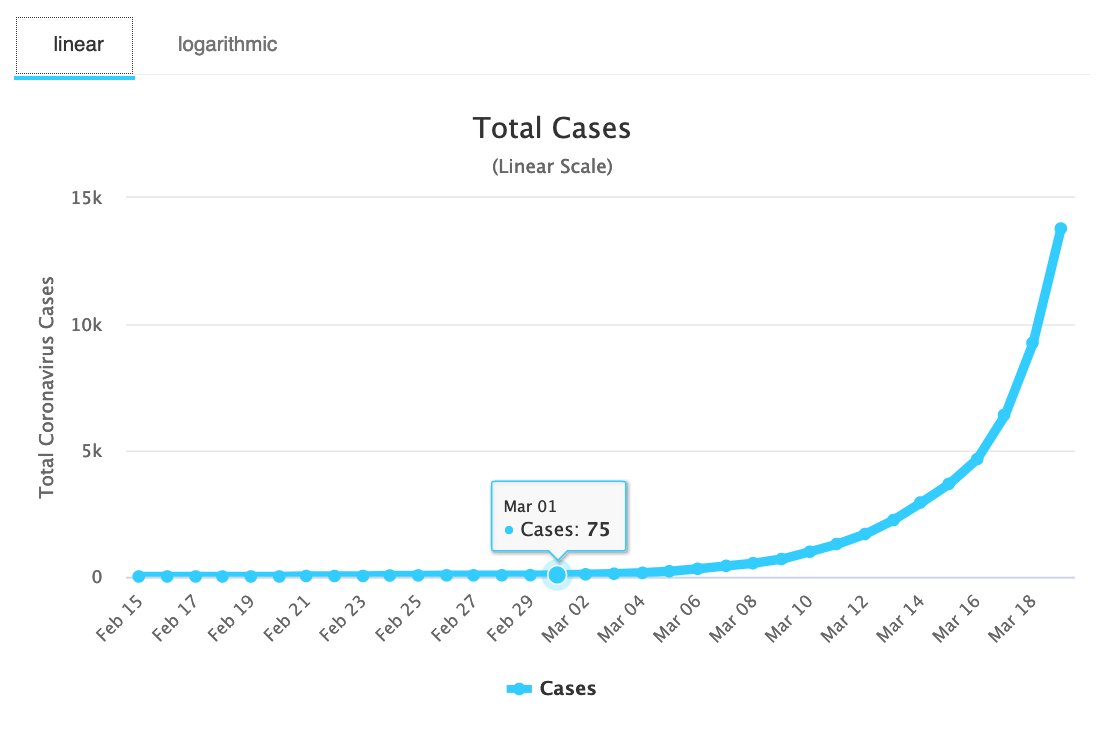
4/n The same chart with a logarithmic scale shows a clear upward trend line that started on March 1. Since then, the slope of the line has been largely constant, indicating a stable exponential growth trend. The crucial time window for drastic U.S. measures was in late February!

5/n Now compare this to South Korea, which has been experiencing a significant decrease in daily new cases since about March 8.
(source: worldometers.info/coronavirus/co…)
(source: worldometers.info/coronavirus/co…)
6/n On the logarithmic scale, South Korea's line converges from a near-90 degree angle towards a horizontal line. Horizontal = zero growth.

7/n South Korea issued highest alert level on Feb 23, schools closed. On Feb 25, the government issued strong warnings to the entire population and started aggressive testing. The chart indicates that over the following 1-2 weeks, daily growth decreased significantly.

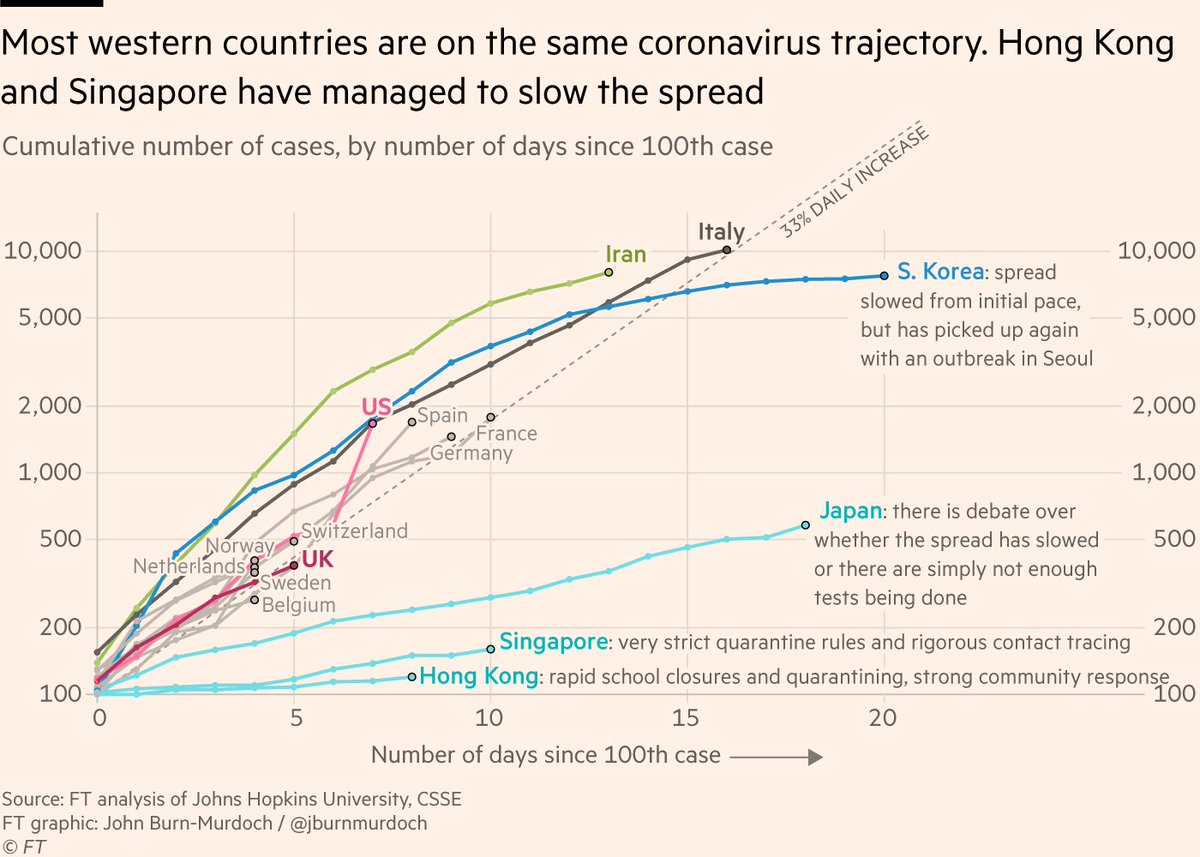
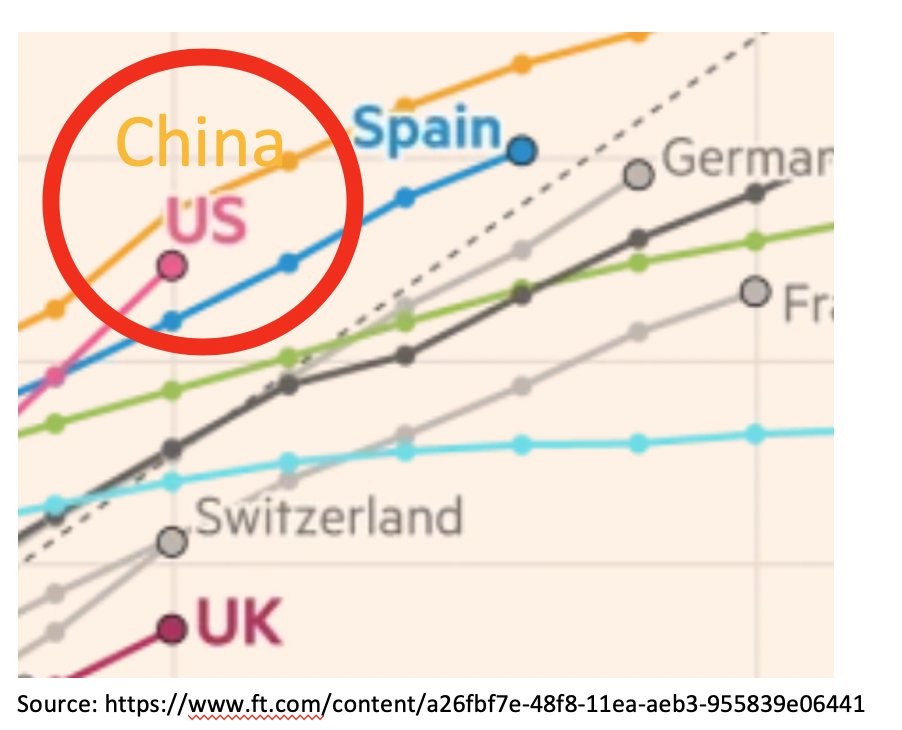
8/n Comparing S. Korea w/ other nations on a logarithmic scale chart shows that Europe/US did not respond as quickly and drastically as S.K. Italy's curve is slowly becoming more horizontal. U.S., UK, Germany are still on full-blown exponential tracks. ft.com/content/a26fbf…
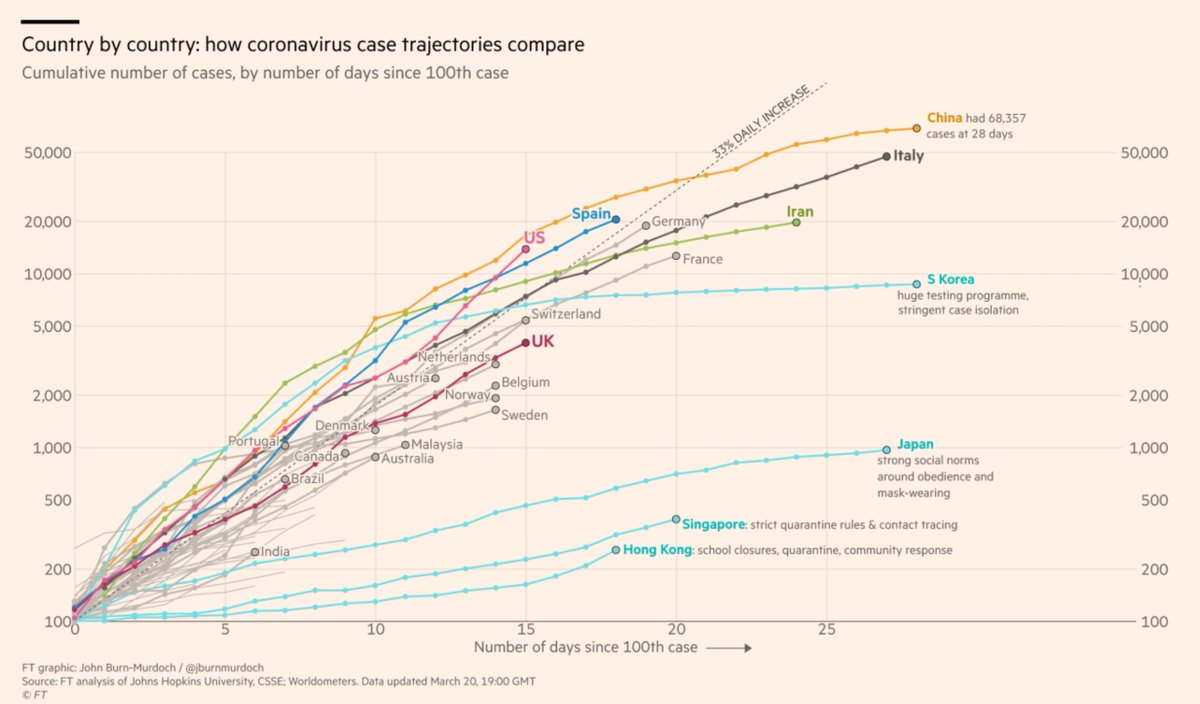
9/n Trend: U.S. overtook S.K. 2 days ago and Spain this morning. Will overtake China today: China had 17,205 cases on equivalent date, U.S. now over 18,000.
BTW the @FT chart enables perfect comparison by showing the data by the number of days since the 100th case.
BTW the @FT chart enables perfect comparison by showing the data by the number of days since the 100th case.

10/n Sources for China (Feb 2nd) and U.S. (March 20th) counts (FT chart data for U.S. is from morning or noon ET time, showing U.S. at about 13k):
worldometers.info/coronavirus/co…
worldometers.info/coronavirus/co…
coronavirus.1point3acres.com/en
worldometers.info/coronavirus/co…
worldometers.info/coronavirus/co…
coronavirus.1point3acres.com/en
11/n Back to U.S. chart: until we see the slope of that line converge to zero, and the line become more horizontal, we still have an essentially uncontrolled outbreak that grows at an exponential rate. And, other key countries have the same trend:

12/n Below you can compare Germany, Italy, U.S. Germany and U.S. are on nearly the same linear trend (U.S. getting steeper), while Italy is just recently getting better (better = lower % increase of daily new cases).


13/13 Common mistake of all these western nations: they did not enact drastic countermeasures until they were over a week into the exponential trend, repeating China's fatal 3 week delay, missing the chance to cut total cases by up to 95%. theguardian.com/world/2020/mar…