There are nearly 2,500 coal power stations around the world.
More than 800 have closed since 2010…
…but another 600 are planned.
We mapped them all – because what happens next is one of the most important stories there is for climate change.
carbonbrief.org/mapped-worlds-…
But the pipeline of new plants is slowing sharply, down by three-quarters since 2015.
carbonbrief.org/mapped-worlds-…
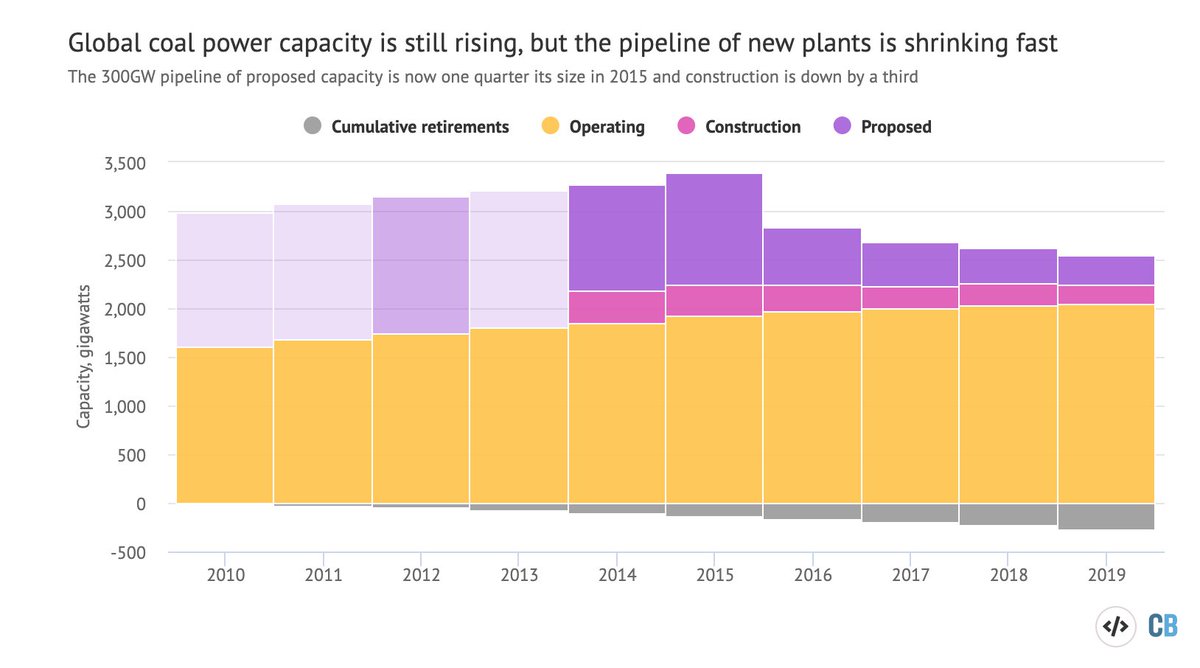
And the number of coal-fired *units* has now been falling for three years.
carbonbrief.org/mapped-worlds-…
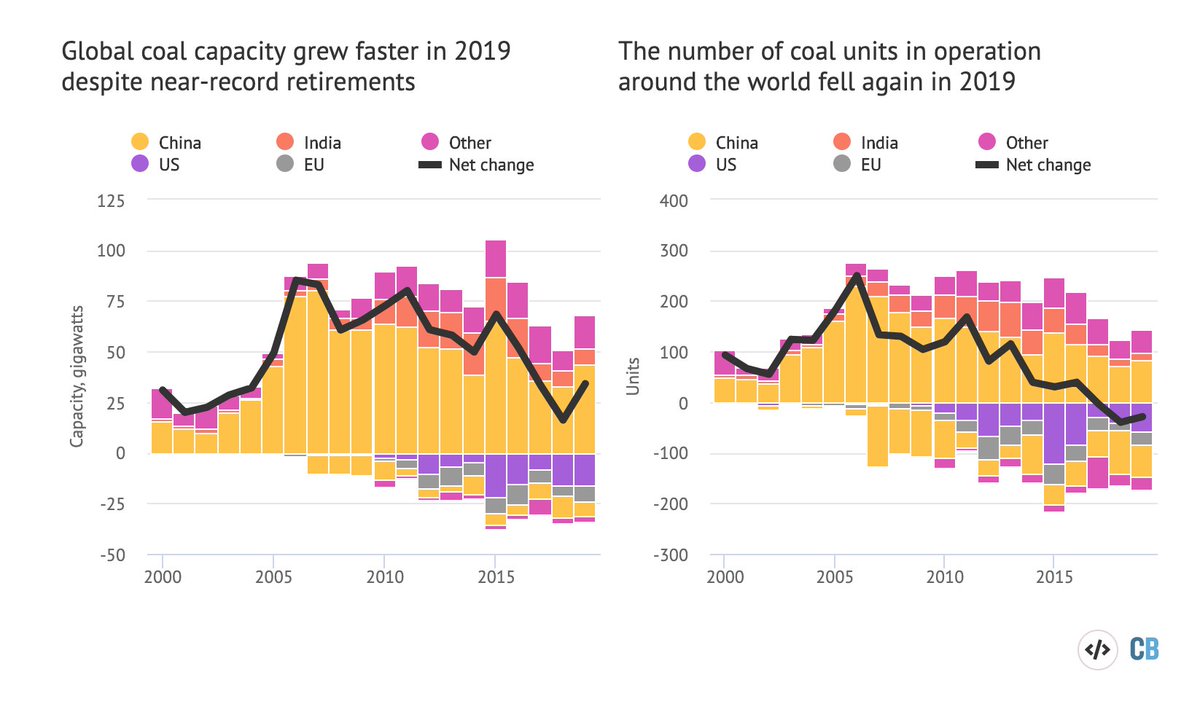
Rising coal capacity
+ Falling coal power output
+ Cheap competition from gas & renewables
––––––––
= Terrible economics for coal
carbonbrief.org/mapped-worlds-…
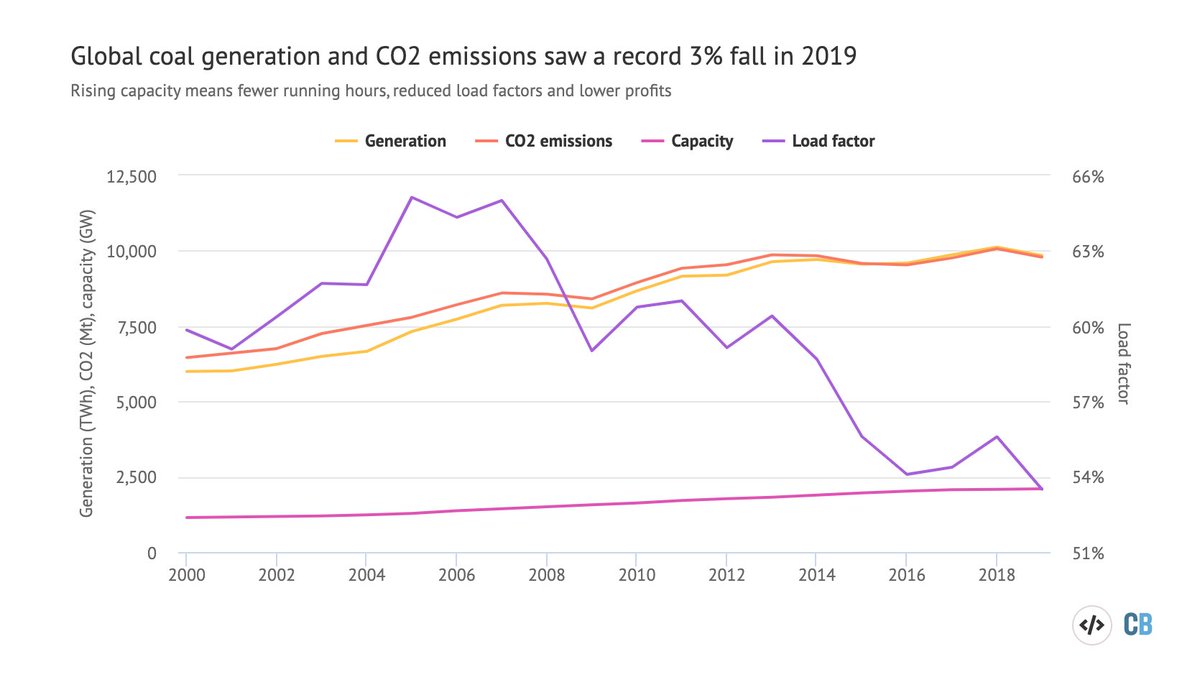
That number is now lowest it's been this century.
49% in the US
37% in EU+UK
49% in China
57% in India
Tough to make a profit on those numbers.
carbonbrief.org/mapped-worlds-…
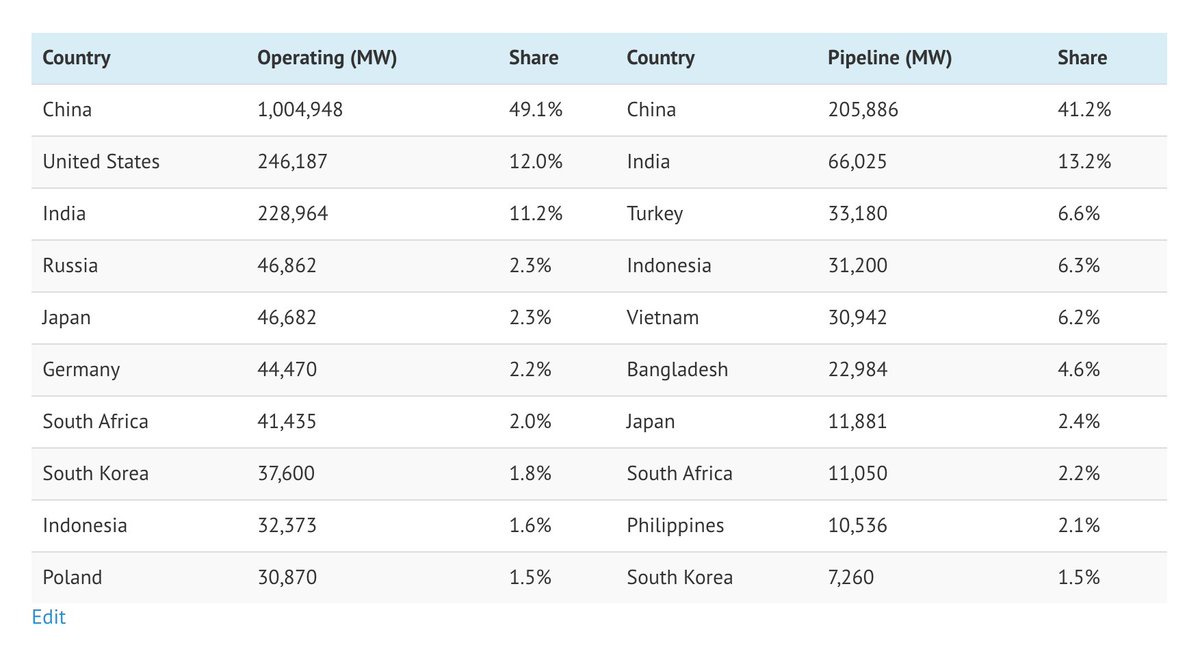
…and the top three alone are 72%
49% China
12% US
11% India
The pipeline of new coal is also highly concentrated.
carbonbrief.org/mapped-worlds-…
Here's how coal capacity has changed in China over the past two decades, with plans for future development shown in pink.
199GW in 2000
1,005GW in 2019
+206GW planned
carbonbrief.org/mapped-worlds-…
carbonbrief.org/analysis-will-…
62GW in 2000
229GW in 2019
+66GW planned
It'd be cheaper to replace much of this with solar…
carbonbrief.org/mapped-worlds-…
339GW in 2010
246GW in 2019
Output fell 19% just last year. By the time planned closures go ahead, the fleet will have halved.
*Retirements average 14GW a year during Trump's tenure*
carbonbrief.org/analysis-will-…
Output here fell 24% last year.
189GW in 2010
143GW in 2019
13 EU members + the UK plan coal phaseouts…
…leaving just 50GW
carbonbrief.org/analysis-will-…
Our map also wouldn't have been possible without the amazing #dataviz skills of @_rospearce
carbonbrief.org/mapped-worlds-…
2018
web.archive.org/web/2019010119…
2019
web.archive.org/web/2020021321…


