Thread: Exponential to Linear & Reopening
On Apr 17, Mr. Trump predicted a MAXIMUM #COVID death toll of 60–65k in 🇺🇸.
I predicted the toll would exceed 65k by today.
That was correct (up to a 24hr reporting delay). Current tally, May 1, is 65,435.
1/
On Apr 17, Mr. Trump predicted a MAXIMUM #COVID death toll of 60–65k in 🇺🇸.
I predicted the toll would exceed 65k by today.
That was correct (up to a 24hr reporting delay). Current tally, May 1, is 65,435.
1/
This was my third correct prediction in a row.
My first prediction was on Apr 4 for Apr 12 (~20k deaths).
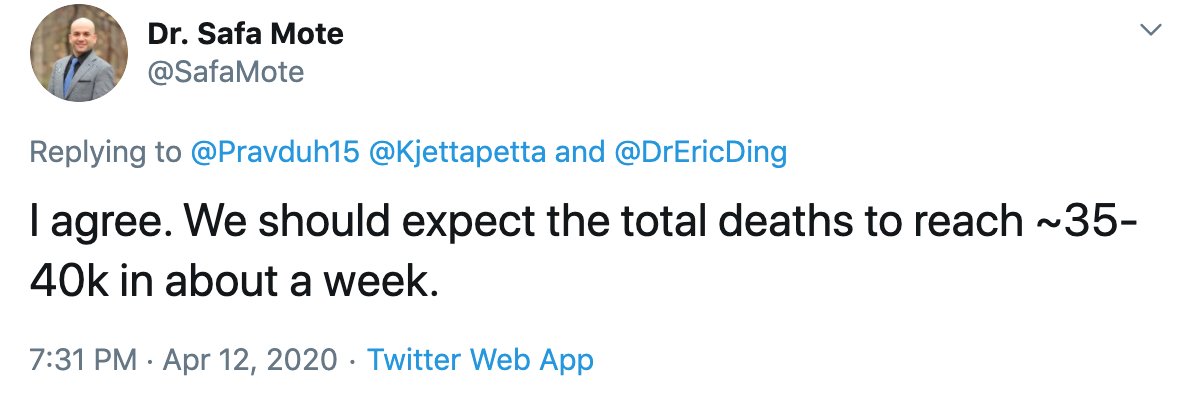
My second prediction was on Apr 12 for Apr 19 (~40k deaths).
2/
My first prediction was on Apr 4 for Apr 12 (~20k deaths).
My second prediction was on Apr 12 for Apr 19 (~40k deaths).
2/
In this pedagogical thread, I will discuss the Exponential trends in cases & deaths, transition to Linear, and the implications for reopening.
To review basic definitions for a Dynamical System, State & Auxiliary Variables, Flows, & Parameters see:
3/
To review basic definitions for a Dynamical System, State & Auxiliary Variables, Flows, & Parameters see:
3/
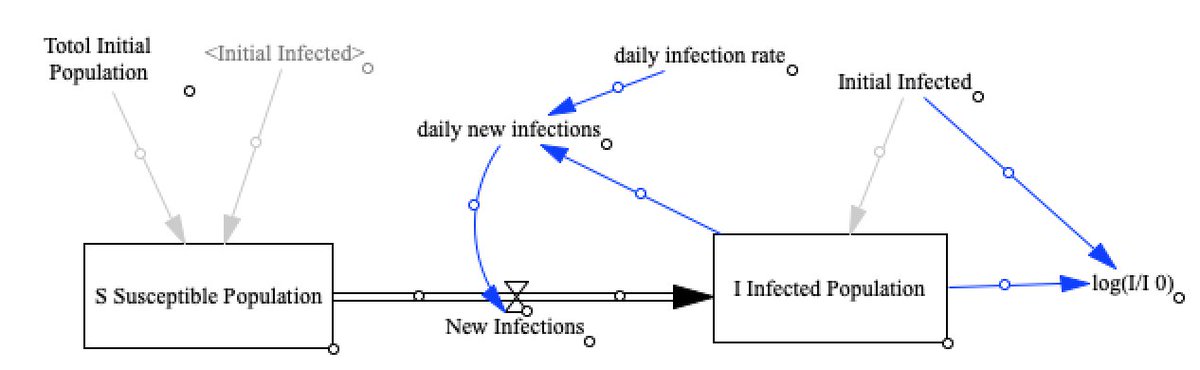
Consider a very simplified model of #COVID epidemic where the total Population is divided into two State Variables: Susceptible (S) and Infected (I).
Here is a schematic that shows these variables together with flows, parameters, and auxiliary variables.
4/
Here is a schematic that shows these variables together with flows, parameters, and auxiliary variables.
4/

Let us assume that we start with only 1 initial infected person on day 0, and a daily infection rate of 0.1 (=10%).
How many infections after 10 days? 2.6 ppl
30 days: 17.5 ppl
60 days: 304 ppl
90 days: 5,300 ppl
100 days: 13,800 ppl
Quiz 1: Calculate the doubling time.
5/
How many infections after 10 days? 2.6 ppl
30 days: 17.5 ppl
60 days: 304 ppl
90 days: 5,300 ppl
100 days: 13,800 ppl
Quiz 1: Calculate the doubling time.
5/

Because of the EXPONENTIAL growth, we often plot variables such as cases and deaths using a logarithmic scale: this will render an exponential curve into a straight line.
6/
6/

So instead of magnitudes (1, 10, 100, etc), one will see the ORDER OF MAGNITUDES (Log(1) = 0, Log(10) = 1, Log(100) = 2, etc.)
Technical note: the plot below uses the Natural log, also denoted as LN, instead of base 10 Log. No fundamental difference.
7/
Technical note: the plot below uses the Natural log, also denoted as LN, instead of base 10 Log. No fundamental difference.
7/

The caveat is that most people would miss the explosive nature of an exponential growth on a log scale plot. The exception would be those who frequently work with log scale plots (e.g., physicists, natural scientists, mathematicians, engineers, etc.)
8/
8/
The slope, s, of this straight line can also give us the doubling time, T_d.
T_d = log(2)/s.
Quiz #2: calculate T_d from this plot; should be the same answer as Quzi #1 in tweet #5.
9/
T_d = log(2)/s.
Quiz #2: calculate T_d from this plot; should be the same answer as Quzi #1 in tweet #5.
9/

This surprising explosive trend is precisely what makes understanding EXPONENTIAL growth very difficult. It is NON-INTUITIVE even for people who are trained to understand it, (i.e., physicists, scientists, mathematicians, engineers, etc.)
10/
10/
So, it is not a surprise that many politicians kept denying the threat of #coronavirus in Jan, Feb, and even Mar 2020.
For example:
nytimes.com/2020/04/11/us/…
11/
For example:
nytimes.com/2020/04/11/us/…
11/
For the same reason, it was not surprising for me that Mr. Trump on Apr 17 — at 36.5k deaths — predicted a MAXIMUM US death toll of 60–65k.
Based on my theory of Kinematics of #COVID, I predicted we would surpass that MAXIMUM by the end of April.
12/
Based on my theory of Kinematics of #COVID, I predicted we would surpass that MAXIMUM by the end of April.
12/
Even more embarrassing was that Mr. Trump repeated his Apr 17 claim of MAXIMUM 60k US deaths on Apr 19, Apr 20, and even Apr 27.
13/
13/
Since Mr. Trump (T) has had ~3 months of meetings w White House #coronavirus Task Force (CVTF), I am left with the following three possibilities about the basic nature of the #COVID epidemic, CTF, & T:
14/
14/
(CVFT: WH Coronavirus Task Force; T: Mr. Trump;)
A) CVTF still does not fully understand COVID epi.
B) CVTF understands COVID epi, but cannot succeed with making T understand it.
C) T understands COVID epi, but lies.
I can't claim to know the answer.
15/
A) CVTF still does not fully understand COVID epi.
B) CVTF understands COVID epi, but cannot succeed with making T understand it.
C) T understands COVID epi, but lies.
I can't claim to know the answer.
15/
Next question: how successful were lockdowns and other mitigation measures such as masks, social distancing, improved hygiene?
To answer this question, I would go back to the dynamic model in tweet # 4 and decrease the daily infection rate.
16/
To answer this question, I would go back to the dynamic model in tweet # 4 and decrease the daily infection rate.
16/
By halving the daily infection rate to 0.05 (5% daily), we will essentially slow the doubling time by only a factor of 2.
BUT instead of reaching 13,800 infections after 100 days, we reach only 132 infections.
See also tweets 19–21 in this thread:
17/
BUT instead of reaching 13,800 infections after 100 days, we reach only 132 infections.
See also tweets 19–21 in this thread:
17/

By reducing the daily infection rate to 0.02 (2% per day), we will essentially change the exponential growth to a LINEAR growth.
Tech note: if you zoom in on any exponential growth, it will look linear. But here we are not changing the time scale; it's still days and weeks.
18/
Tech note: if you zoom in on any exponential growth, it will look linear. But here we are not changing the time scale; it's still days and weeks.
18/

This is the goal of MITIGATION efforts in the #COVID epidemic: slowing daily new cases to such low levels that would make Contact Tracing and Isolation of patients feasible.
19/
19/
Are we ready to go back to business as usual, or even loosen up?
To answer this, let's have a look at data for daily new cases.
20/
To answer this, let's have a look at data for daily new cases.
20/
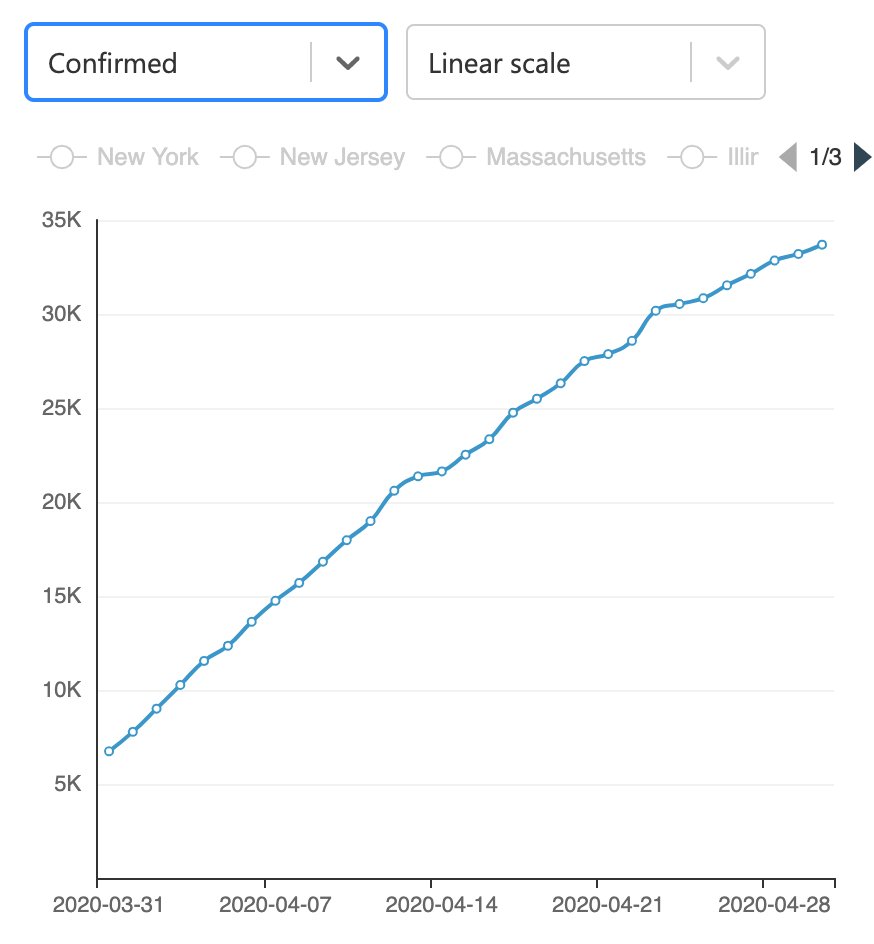
First, the good news: the mitigation measures have worked!
For example, the US has transitioned from an exponential growth of daily new cases (straight line on log scale) to a relatively constant level of daily new cases.
BUT this constant level is very large, 30k per day.
21/
For example, the US has transitioned from an exponential growth of daily new cases (straight line on log scale) to a relatively constant level of daily new cases.
BUT this constant level is very large, 30k per day.
21/

That means we are still far from reopening.
On the other hands, countries where daily new cases are at the level of ~10 or so can reopen: #SouthKorea, #NewZealand, #Australia, and very soon #Norway & #Austria.
22/
On the other hands, countries where daily new cases are at the level of ~10 or so can reopen: #SouthKorea, #NewZealand, #Australia, and very soon #Norway & #Austria.
22/

But even in that case, reopening does not mean going back to business as usual. Big events & crowded indoor spaces are absolute NO-NOs. We should remember the Feb 16 super-spreading event in #Dague, #SouthKorea & others:
23/
23/
These lockdowns have helped to transition #Maryland from an Exponential phase into a Linear phase. But the slope of the cumulative cases curve is still pretty steep, translating to an average of about ~800 daily new cases.
25/
25/

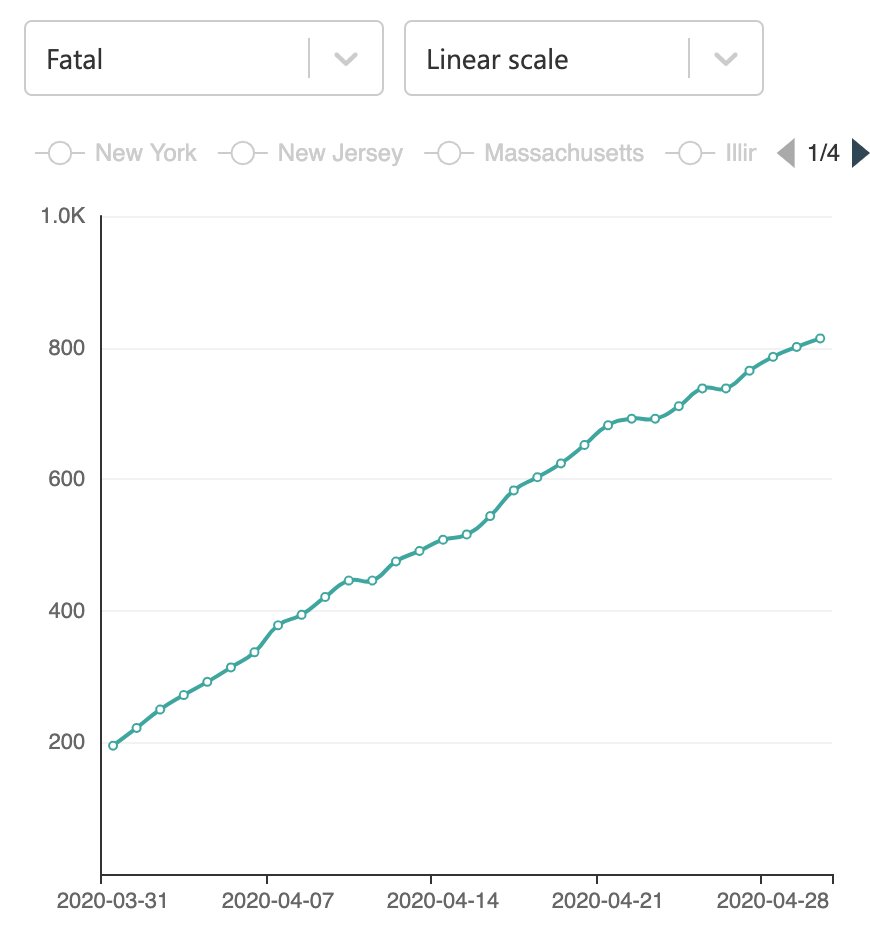
Total hospitalizations in MD have started to decline for the first time after 6 weeks of lockdowns.
This reminds us of the important issue of DELAYS. There is a long delay between infections, onset of symptoms, and deaths. So, we must be patient.
26/
This reminds us of the important issue of DELAYS. There is a long delay between infections, onset of symptoms, and deaths. So, we must be patient.
26/

A recent slowdown in new cases can be seen in #Florida. It went from an average of ~1,000 daily new cases in early April down to ~600 daily new cases. This could be an artifact of lower testing, since deaths are still steadily increasing at ~50 deaths per day.
27/
27/


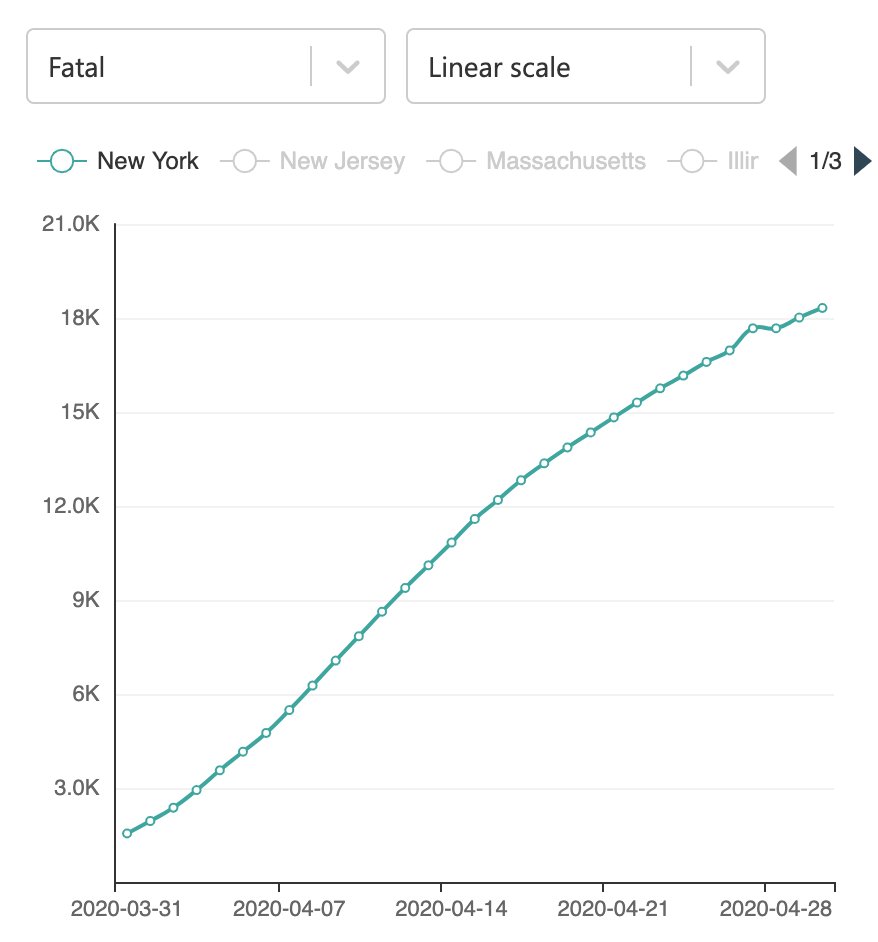
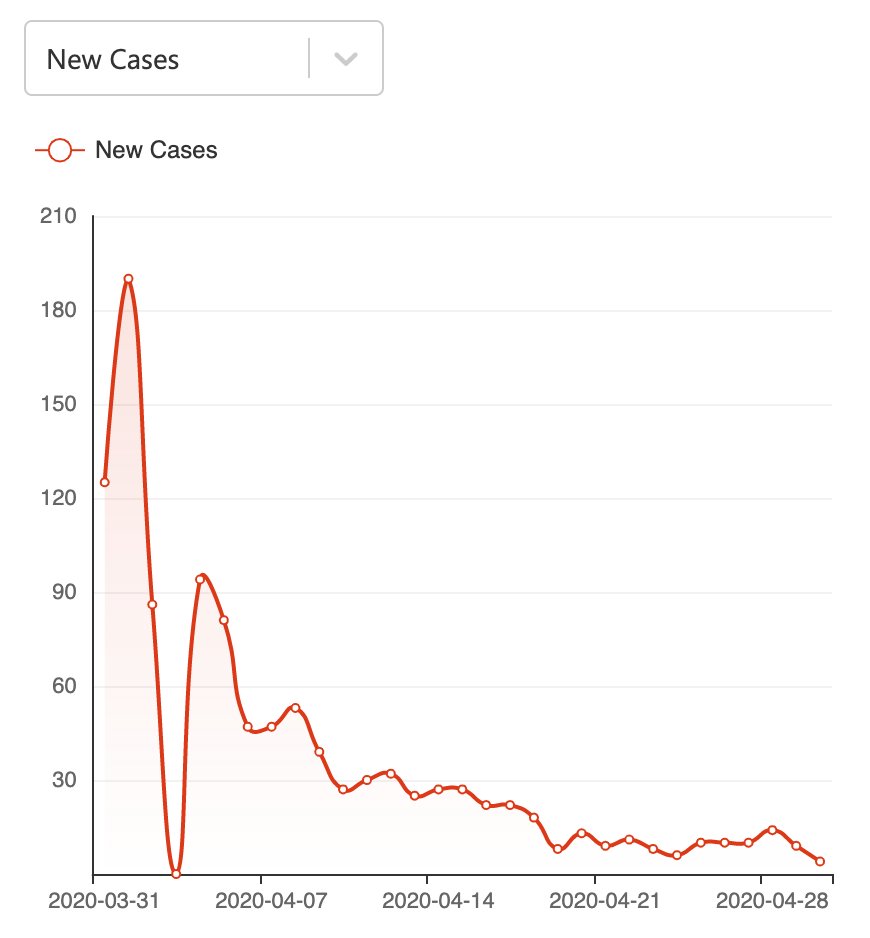
#NewYork State has seen a major slowdown: from ~9k daily new cases to ~5k, and from ~800 daily deaths to ~300 deaths.
29/
29/

TOTAL vs ACTIVE cases (= Total – Recovered) shows that the infection MOMENTUM leads to continuous growth of active cases long after implementation of mitigation measures.
Moreover, it shows recoveries are very slow: #COVID causes a long illness.
30/
Moreover, it shows recoveries are very slow: #COVID causes a long illness.
30/

Compare these to #SouthKorea, where daily new cases dropped from ~200 to less than 10. And daily deaths are ~1.
31/
31/


Or to #Austria, where daily new cases have dropped from ~500 to ~50, and daily deaths are at ~5.
33/
33/


In #Sweden, however, daily new cases have accelerated from ~300 to ~700, & daily deaths have also accelerated from ~50 to over 100. Sweden has implemented regular precautions such as physical distancing, masks, improved hygiene. The sharp contrast is because of NO lockdowns.
34/
34/


To summarize, a combination of multiple mitigation measures — masks, improved hygiene, physical distancing, lockdowns — leads to a deceleration of #coronavirus epidemic, like pushing the brake pedal for a car.
35/
35/
But the virus itself is naturally pushing the accelerator pedal. So, depending on how hard we push the brake pedal, we might be able to slow the virus, and even defeat it, as in #Taiwan, #SouthKorea, #Iceland, #China, #NewZealand, #Australia, #Austria, #Norway, etc.
36/
36/
But claiming an early victory will allow the epidemic to accelerate again, reaching peaks at even higher daily levels.
We should use this lockdown time efficiently by properly educating the public about #COVID on TV, e.g., during daily WH briefings.
37/
We should use this lockdown time efficiently by properly educating the public about #COVID on TV, e.g., during daily WH briefings.
37/
We should also avoid politicizing #coronavirus at all costs. The virus does not care about our politics or ideology. So instead of being frightened of (or blaming) an "invisible enemy", we should allow SCIENCE to help us understand it, which will then help us control it too.
38/
38/
My thanks to @FT @jburnmurdoch @bing @StateMaryland for their datasets and plots.
And a big thank you to all of the readers for your time, constructive comments, RTs, & likes.
40/
/end
And a big thank you to all of the readers for your time, constructive comments, RTs, & likes.
40/
/end
@threadreaderapp unroll