Congratulations to Ethiopia and Ethiopians everywhere on today's completion of the 2nd filling of the #GERD. It has been a great honour to follow along during this moment.
Today's rainfall forecasts for #NorthAfrica, #HornOfAfrica and #MiddleEast follow.
Today's rainfall forecasts for #NorthAfrica, #HornOfAfrica and #MiddleEast follow.
https://twitter.com/iyoba4u/status/1417127026461396994?s=20
In honour of the #GERD we will change up the order of today's bulletin and get right to the most important issue, rain over the #Abbay basin, which due to its great quantity and consistency made this possible over such a short time period.
But first a brief explanation, as when it comes to the GERD not all rainfall counts. The first image here shows the path of the #BlueNile / #Abbay from Lake Tana to Khartoum where it meets the White Nile and becomes "The Nile". 

This map shows the major watersheds of the Nile. The #BlueNile is the most important & provides 59% of all Nile flow.It is also the most consistent. While there are three rivers flowing out of the basin, the other two are minor compared to the #Abbay.

As today is a day for history, it is also worth referencing the history of the dam which can be found here. en.wikipedia.org/wiki/Grand_Eth…
The dam's construction began in 2011 under then Ethiopian PM Meles Zenawi, but it is an idea which goes back a lot longer. It's a long long story.
The dam's construction began in 2011 under then Ethiopian PM Meles Zenawi, but it is an idea which goes back a lot longer. It's a long long story.
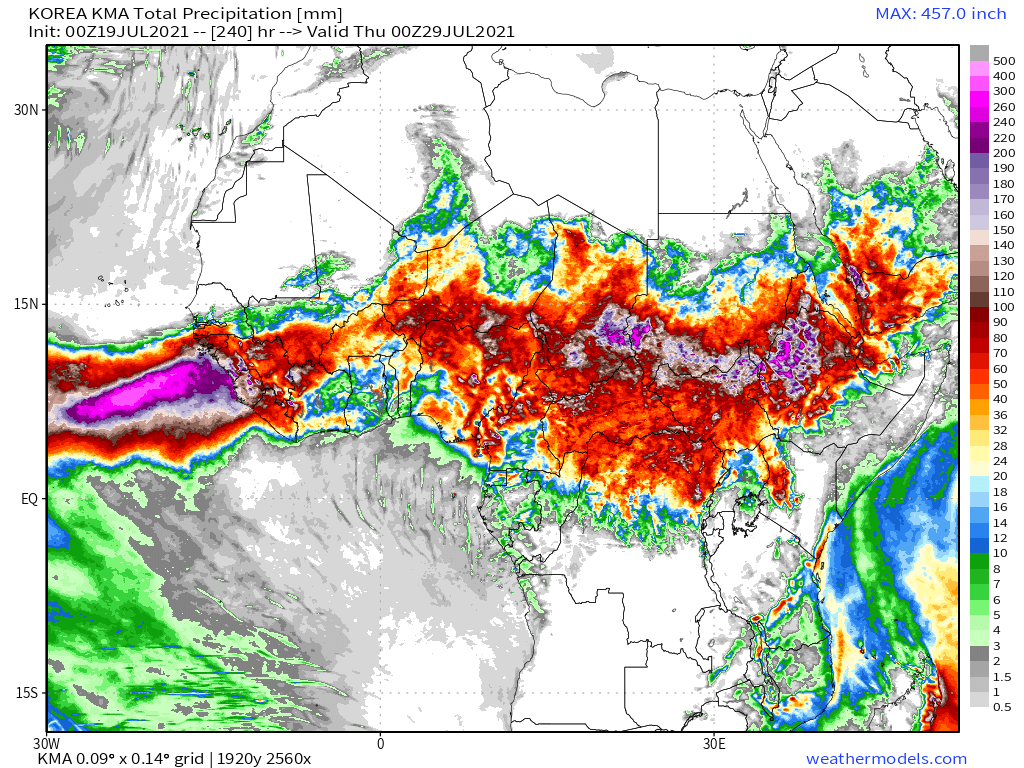
Today's July 19th 10-day rainfall forecasts for #Ethiopia (+1 12-day from KMA) and the #HornOfAfrica: #Somalia, #Somaliland, east #SouthSudan, south east parts of Sudan, #Djbouti and #Eritrea.
Purple heaviest rain covers #Tigray, & #Abbay (#GERD) & #TekezeAtbara basins.
Purple heaviest rain covers #Tigray, & #Abbay (#GERD) & #TekezeAtbara basins.


Purple areas are receiving on average a little under an inch of rain each day. The area of the basin inside Ethiopia is approximately 160,000 square kms.
On this basis I reckon rainfall over the area is somewhere around 3 BCM (billion m2) per day.
On this basis I reckon rainfall over the area is somewhere around 3 BCM (billion m2) per day.
Which is definitely one of mother natures greatest miracles. And ideal for generating electricity. [Note: This is a process which does not consume any water.]
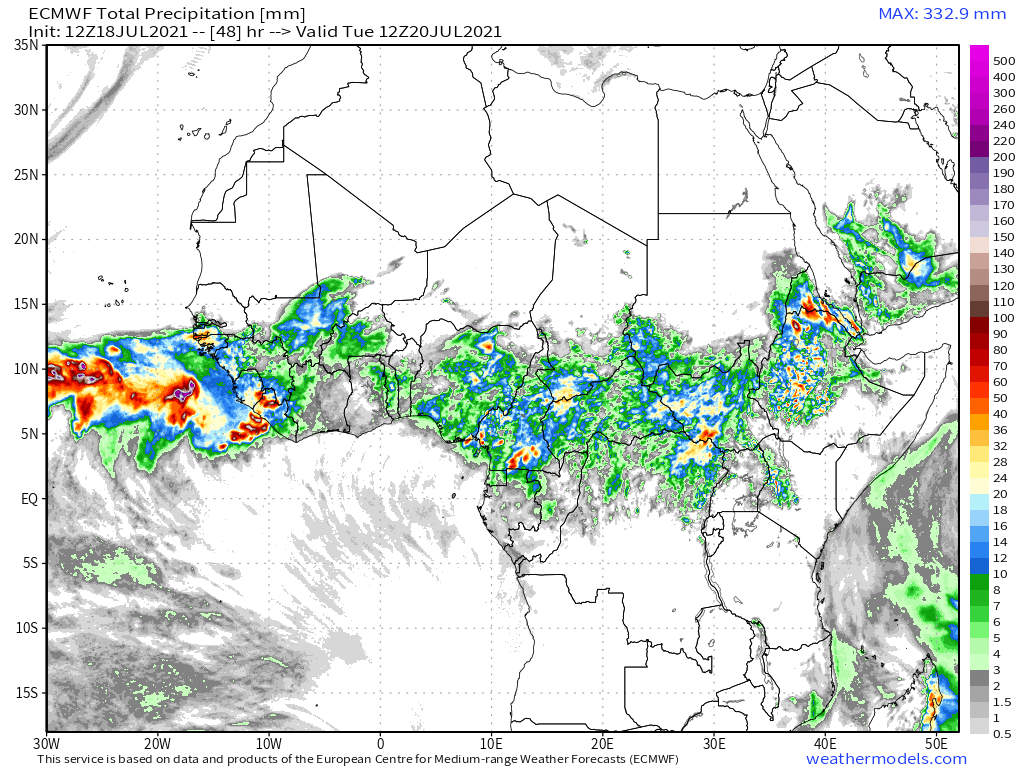
48 Hour forecasts (today and tomorrow) from the same three models. (= Aprox 0.6BCM in the #Abbay)
48 Hour forecasts (today and tomorrow) from the same three models. (= Aprox 0.6BCM in the #Abbay)


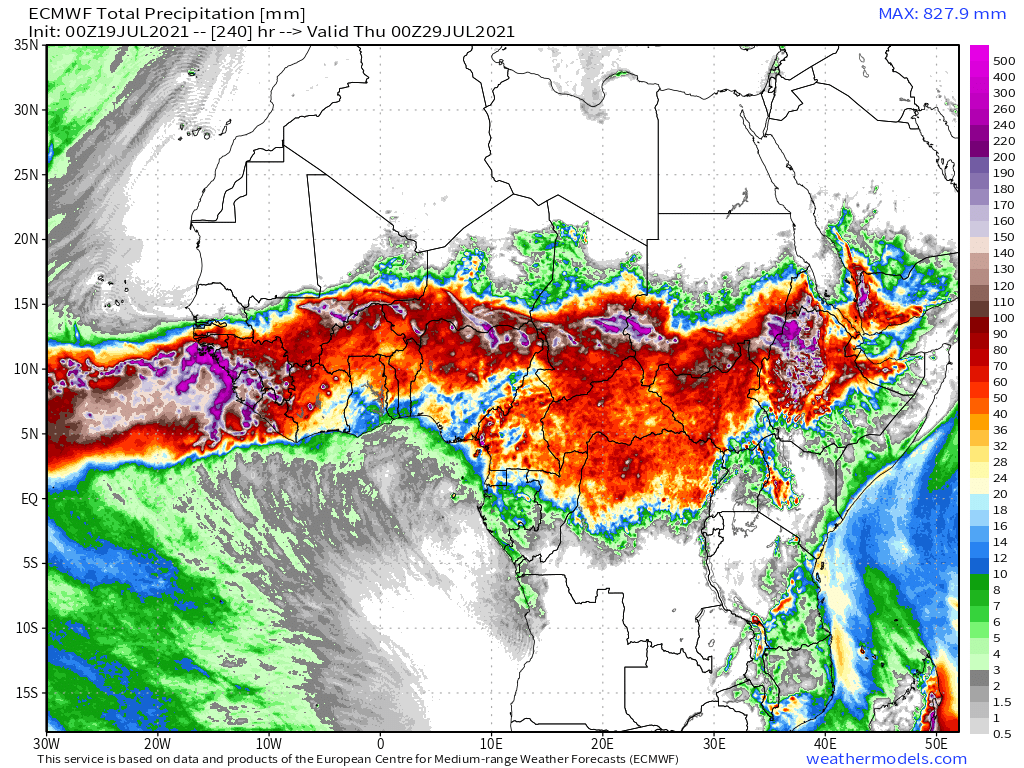
And today we have an additional 4-day forecast from the three models. (= approx 1.2BCM in the #Abbay)


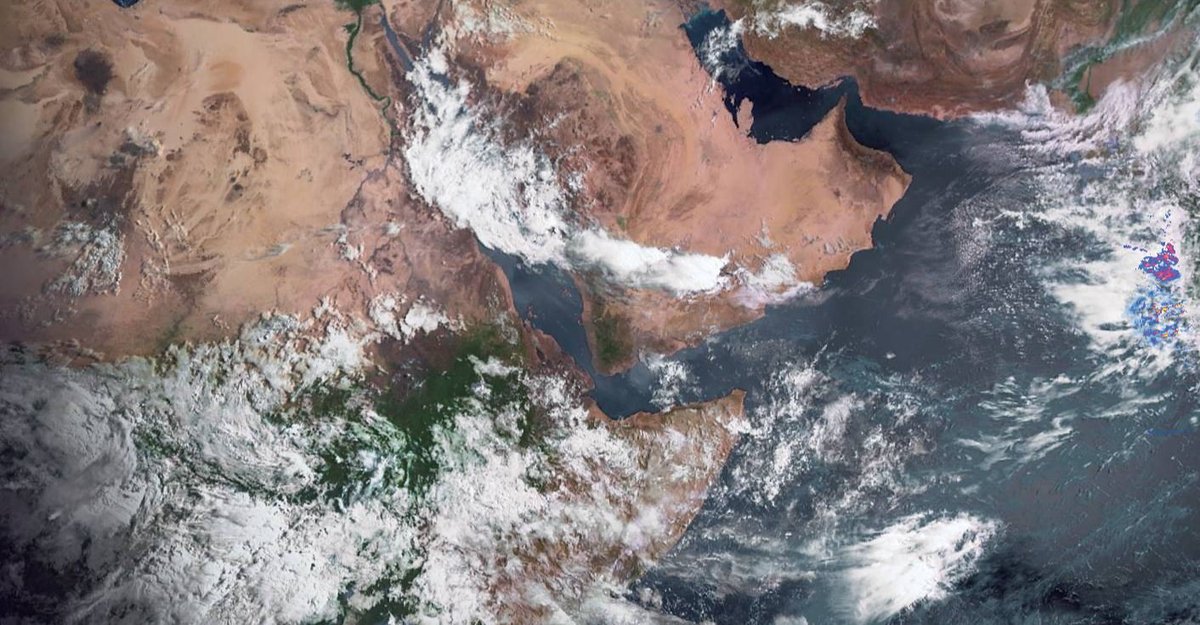
These daily forecast bulletins address weather in an explanatory manner. For several ays we have been following an #ArabianMonsoonBurst which has seen very unusual weather over the Arabian Peninsula. This is ongoing. Here's a region wide picture from this morning.
Yesterday's bulletin is in the quoted thread for those who are interested >>
Most of these twitter threads are archived here and go back to April. threadreaderapp.com/user/althecat
https://twitter.com/althecat/status/1416760249927798792?s=20
Most of these twitter threads are archived here and go back to April. threadreaderapp.com/user/althecat
Today's story begins where last night's one finished. With a remarkable storm centered over the Saudi Red Sea Coast near Mecca. This animation finishes around midnight local time.
With this one following through the night till the morning.
Picking up from above we zoom out. And at the bottom we can see the monsoon rains picking up over the Ethiopian highlands as they do each day in the afternoon during the big rainy season a.k.a. the #EastAfricanMonsoon
Moving to the east across the Arabian sea (at the same time up to around 2pm EAT) we see the engine which is powering this. The Indian Monsoon, another miracle of nature.
And this view joins it all up. The flows of water between the regions are remarkably complex. Early in the Indian Monsoon this year we saw significant atmospheric water flow from Africa over Yemen and Oman to India. And if you look closely you can see that this process continues.
Here we see a rain trace view from @Meteoblue this afternoon showing its estimate of the rainfall from satellite data.

While this still image from this morning provides a clearer view of the water baring clouds, many of which disappear once the sun comes up. The best cloud views from satellite can be seen as the sun is rising or setting.

Now in case you are wondering there is a point to all this.
The unusual weather we are seeing is caused by climate change, models for which predict more rainfall in this region as the planet warms. We have been seeing this play out spectacularly all year.
The unusual weather we are seeing is caused by climate change, models for which predict more rainfall in this region as the planet warms. We have been seeing this play out spectacularly all year.
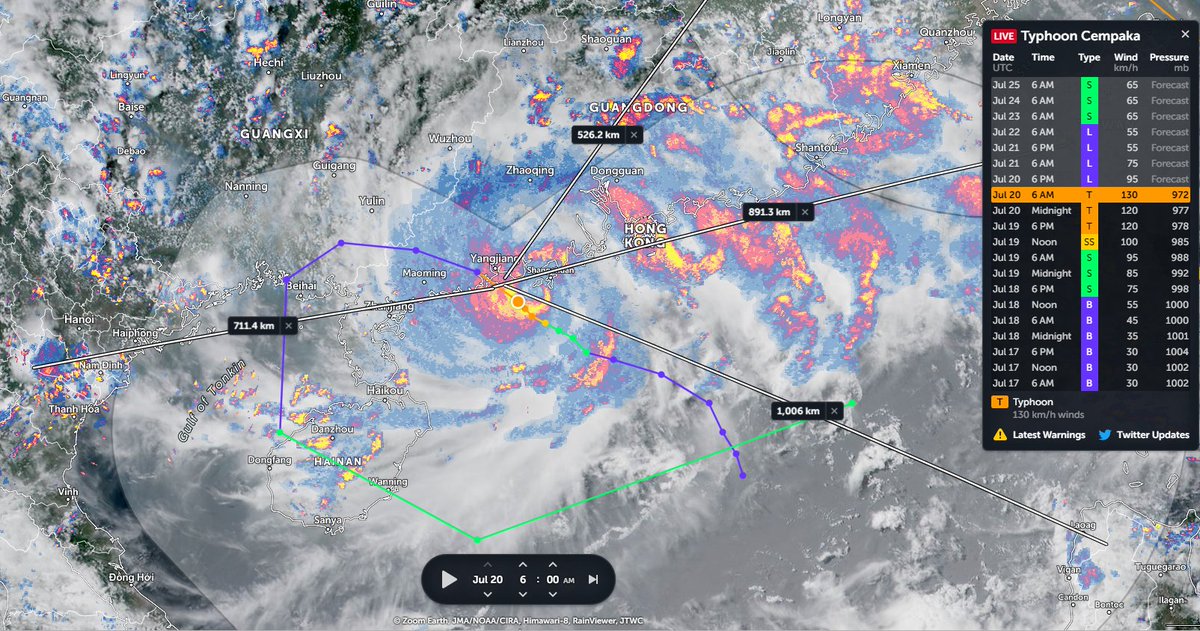
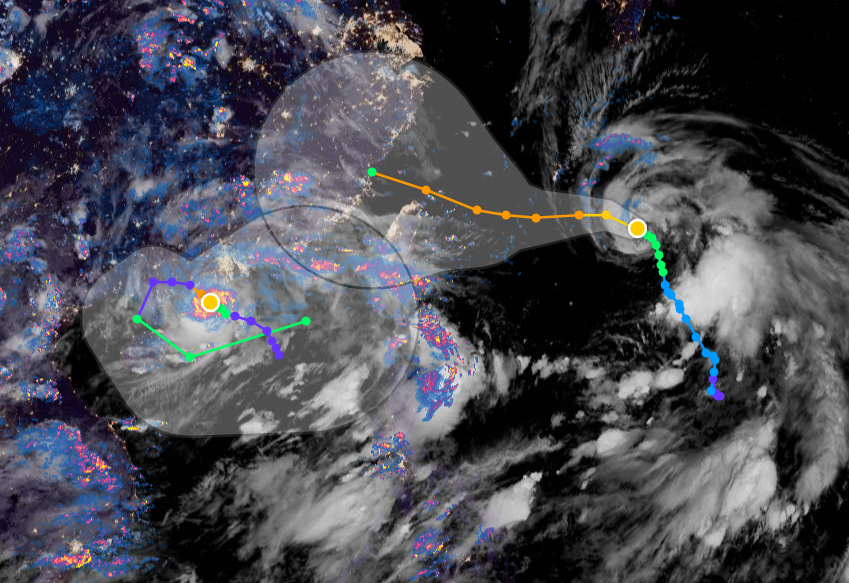
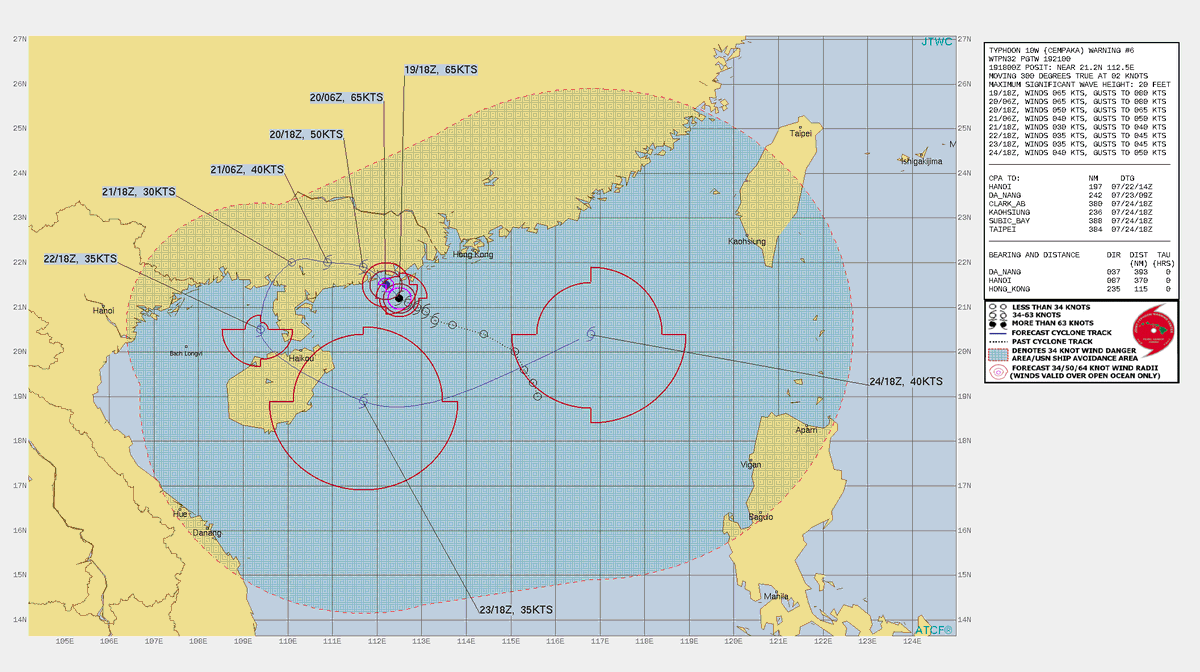
Today my attention has moved even further east to the West Pacific where a particularly spectacular show of the power of tropical monsoons is unfolding.
https://twitter.com/althecat/status/1417049602453348352?s=20
But my primary focus is Africa, &specifically in the Sahara. In March I was looking for #DesertRain. I found it Algeria and got hooked. After shifting my attention to Ethiopia and discovered the #GERD. And as the weather continued to get weirder I have learned more about it.
^^ the plot above and this one are now my hunting ground looking for weather anomalies (they show atmospheric moisture) which as we discovered in the recent floods in Europe can give rise to catastrophes at massive scale.
They are forecasts, in this case for 5 days, and produced by super-computer global weather models. And they are I think the beginning of what will become a global weather warning system for impending disasters.
The first one shows PWAT anomaly, compared with a 1981-2010 climate data set. I.E. when water is in places that it is not supposed to be. And WRT to the Sahara right now it is exceptionally interesting.
This is the picture now with water levels 2-3x normal in the #MiddleEast.
This is the picture now with water levels 2-3x normal in the #MiddleEast.

This image shows the Sahara in four days, and I am very curious as to how much #DesertRain this will bring. [Animation tweet also quoted for reference.]
https://twitter.com/althecat/status/1417149440712921099?s=20

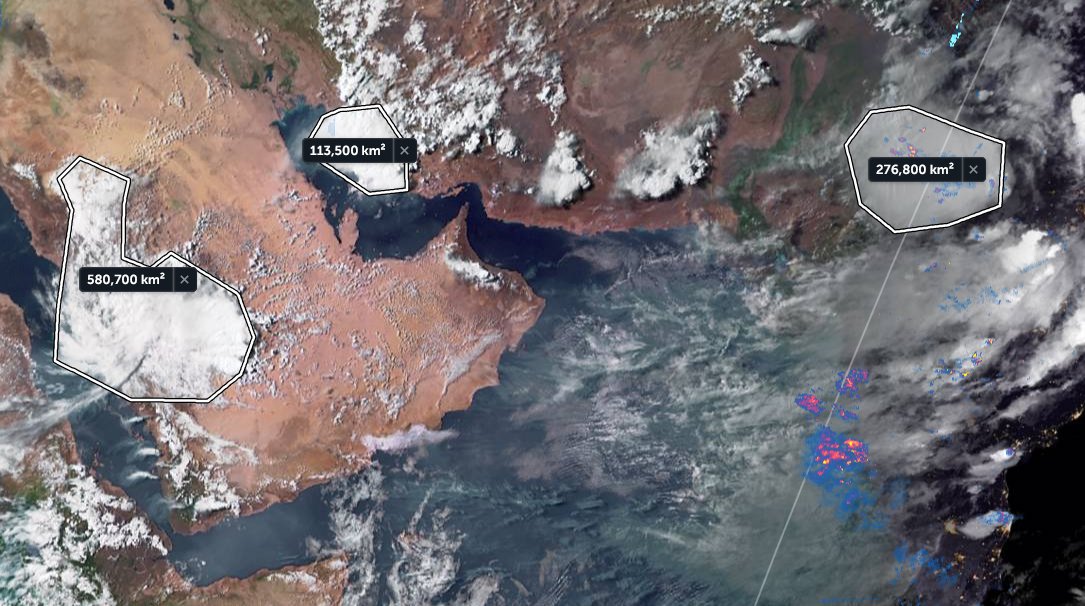
Here's a live picture over the Sahara from @zoom_earth [a free service which I would strongly recommend to anyone curious about these things.]
This is before the forecast much higher levels of - out of place - atmospheric water has arrived.
This is before the forecast much higher levels of - out of place - atmospheric water has arrived.

And on that note we return to the regular forecast part of this bulletin beginning with #NorthAfrica where you will see the latest model rainfall forecasts for the Sahara.
Today's 10-Day Rainfall forecasts for North Africa from July 18th through July 29th.
Today's 10-Day Rainfall forecasts for North Africa from July 18th through July 29th.


You will see here that the models have different views. Over a shorter time period (here we see 48 hour forecasts for #NorthAfrica) the differences become more obvious. But there is also a lot they agree on, especially at close range timewise.


Finally for #NorthAfrica we have the long-range 16-day (GFS) and 12-day (KMA) forecasts - which (as always) remain remarkably well aligned in spite of the 4 days difference. The KMA is consitently more bullish on #DesertRain.


Introducing the final section of the Bulletin, which relates the #MiddleEast we have a three hour animation of storms at the end of the day.
And in the #MiddleEast we also have a source of eyewitness reports to help inform us about what is happening beneath the clouds. The wonderful @Arab_Storms twitter account which hails from the #UAE.
For some reason he has chosen with a couple of exceptions to mainly post comedy tweets about rain and flooding which are pretty good.
Here's the first one.
Here's the first one.
https://twitter.com/Arab_Storms/status/1417115369093881865?s=20
The second, on which he invites you to comment.
https://twitter.com/Arab_Storms/status/1417089519686389760?s=20
The next two deal with the serious issue of crossing rivers in flood. It is generally not a good idea as both of these guys discovered.
https://twitter.com/Arab_Storms/status/1417059173381152771?s=20
This guy was particularly foolhardy. I presume he survived. In NZ we are taught not to do this a lot. Partly because no matter how good a swimmer you are you never have any idea about what else is in the river with you. A log can easily kill you.
https://twitter.com/Arab_Storms/status/1417028459885387779?s=20
July 19th 10-Day accumulated rain forecasts for the #MiddleEast from the GFS, CMC, KMA & ACG weather models.
#ArabianStorms
#KSA #Yemen #Oman #Jordan #Sudan #Iran #Syria #GERD #Sudan #DesertRain #UAE
الله أعلم
#ArabianStorms
#KSA #Yemen #Oman #Jordan #Sudan #Iran #Syria #GERD #Sudan #DesertRain #UAE
الله أعلم


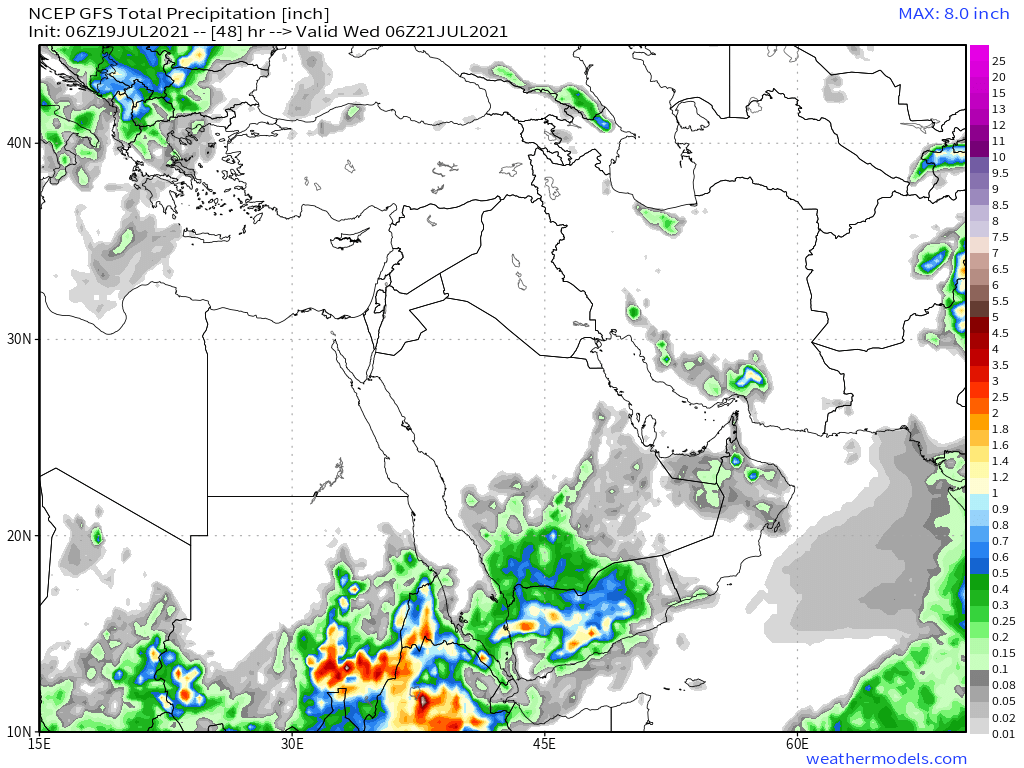
48 Hour July 19th (today and tomorrow), accumulated rain forecasts for the #MiddleEast from the GFS, CMC, KMA and ACG weather models.
#ArabianStorms
#KSA #Yemen #Oman #Jordan #Sudan #Iran #Syria #GERD #Sudan #DesertRain
الله أعلم
#ArabianStorms
#KSA #Yemen #Oman #Jordan #Sudan #Iran #Syria #GERD #Sudan #DesertRain
الله أعلم


And finally we have today's ultra long-range #MiddleEast July 19th rainfall forecasts.
The16-day GFS & GEFS models, the 12 day KMA and the 15 day EPS (Euro ensemble) model forecasts.
الله أعلم
The16-day GFS & GEFS models, the 12 day KMA and the 15 day EPS (Euro ensemble) model forecasts.
الله أعلم


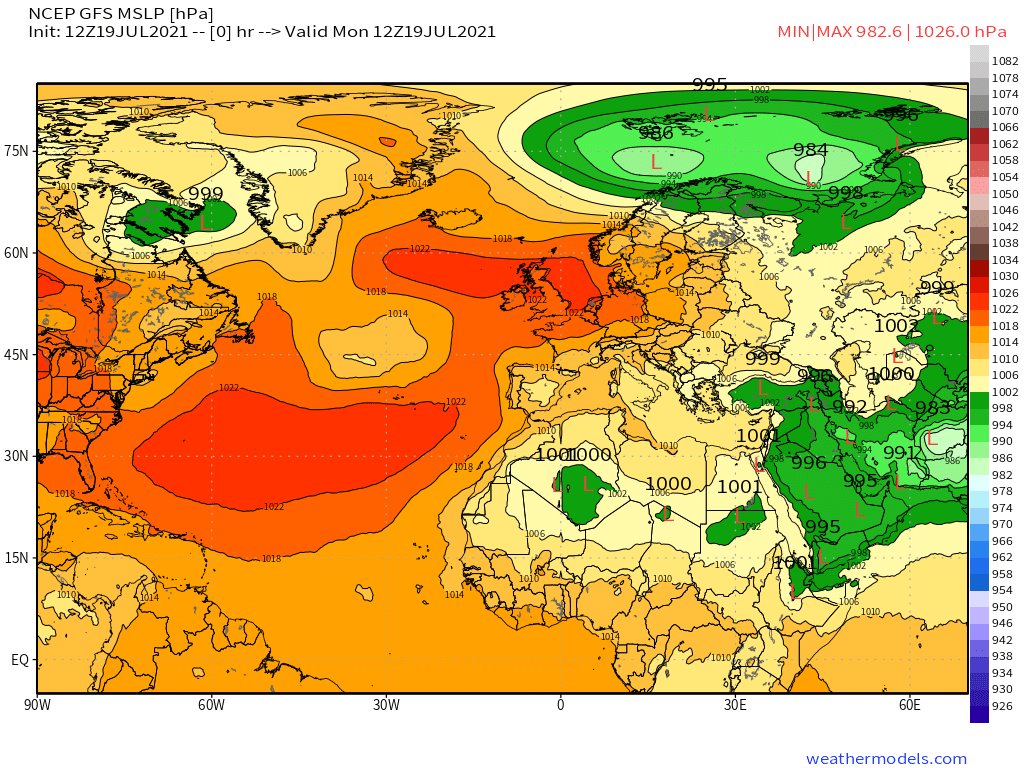
We end with a big picture view. North Western Hemisphere zero hour simulation data (i.e. now).
1. Precipitable water PWAT anomaly
2. PWAT (potential rain + energy)
3. MLSP (Mean Sea Level Pressure)
4. 250Hpa (jet stream winds approx 11-15 kms high)
1. Precipitable water PWAT anomaly
2. PWAT (potential rain + energy)
3. MLSP (Mean Sea Level Pressure)
4. 250Hpa (jet stream winds approx 11-15 kms high)


/ENDS
@Threadreaderapp unroll
@Threadreaderapp unroll
• • •
Missing some Tweet in this thread? You can try to
force a refresh