Some slides from today's Global Policy Analysis class at @econ_uzh:
Population growth:
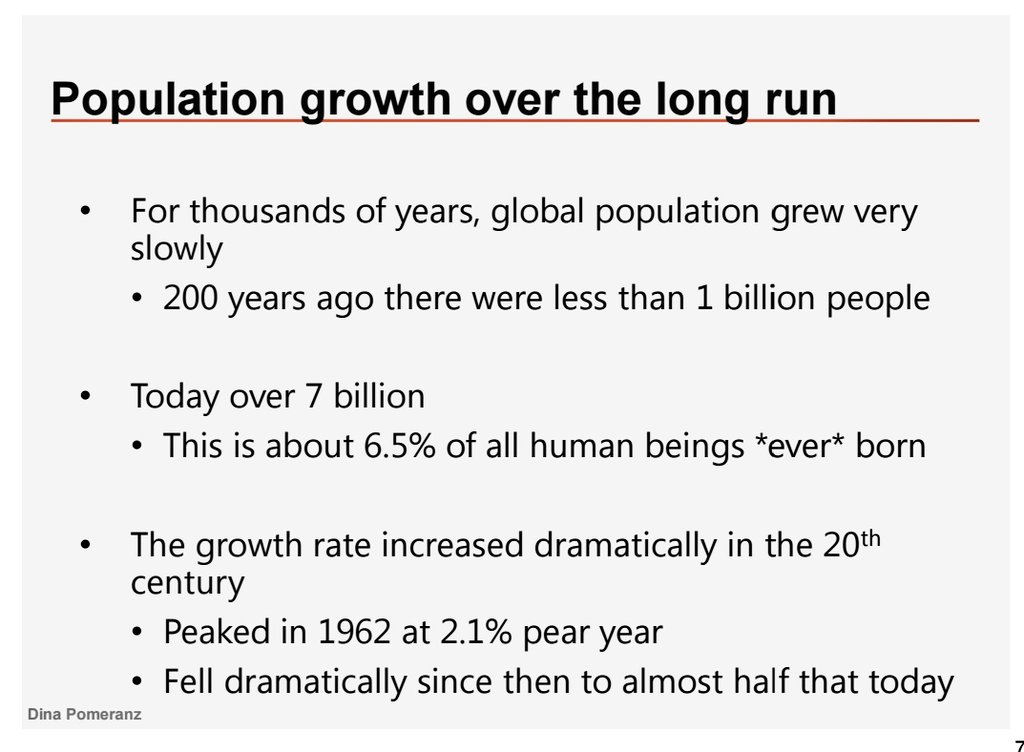
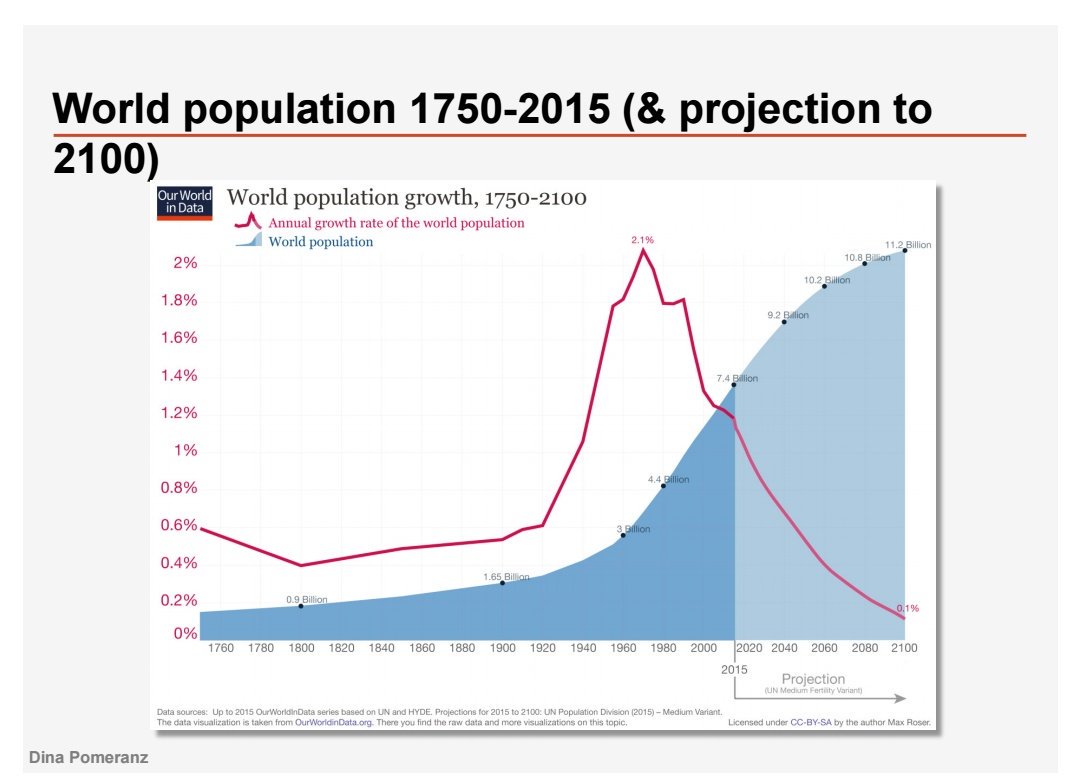
- The 7.5 billion people alive today represents about 6.5% of all human beings *ever* born.
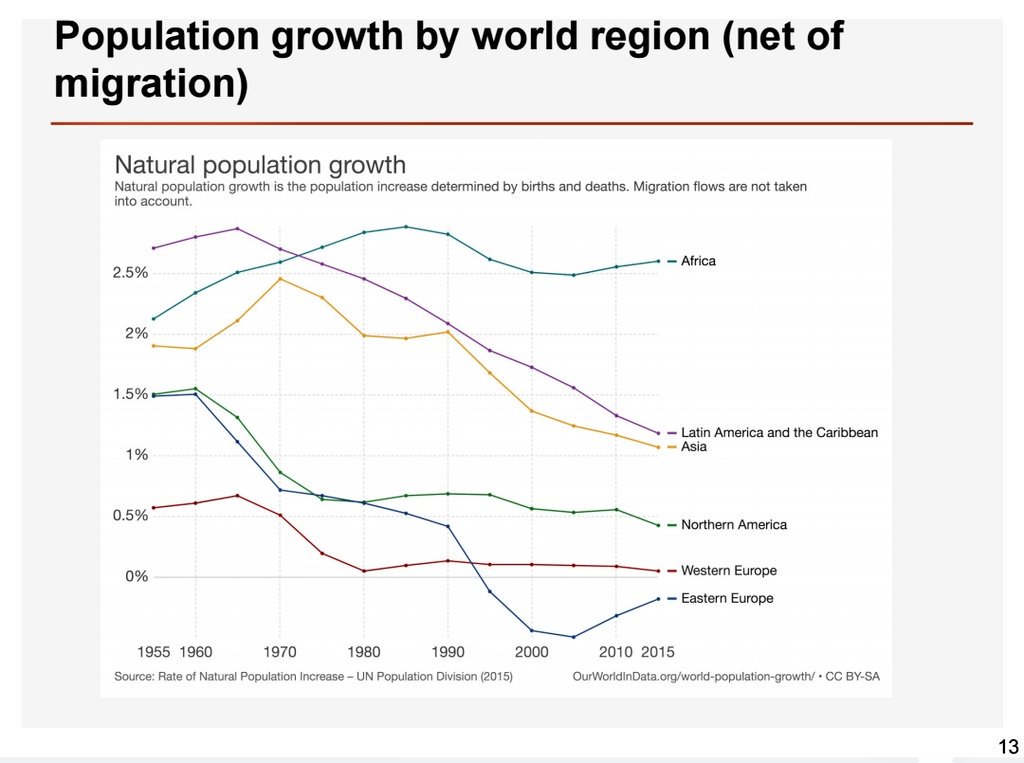
- Global population growth rate peaked in 1962 at 2.1% pear year & fell to almost half since then.
Population growth:
- The 7.5 billion people alive today represents about 6.5% of all human beings *ever* born.
- Global population growth rate peaked in 1962 at 2.1% pear year & fell to almost half since then.
The African continent currently has the highest population growth.
How quickly African population growth rate will fall, as the continent goes through the demographic transition, will play an important role in determining how large the total global population will end up being.
How quickly African population growth rate will fall, as the continent goes through the demographic transition, will play an important role in determining how large the total global population will end up being.
The number of children worldwide has almost stopped growing and will is projected to remain constant at around 2 billion.
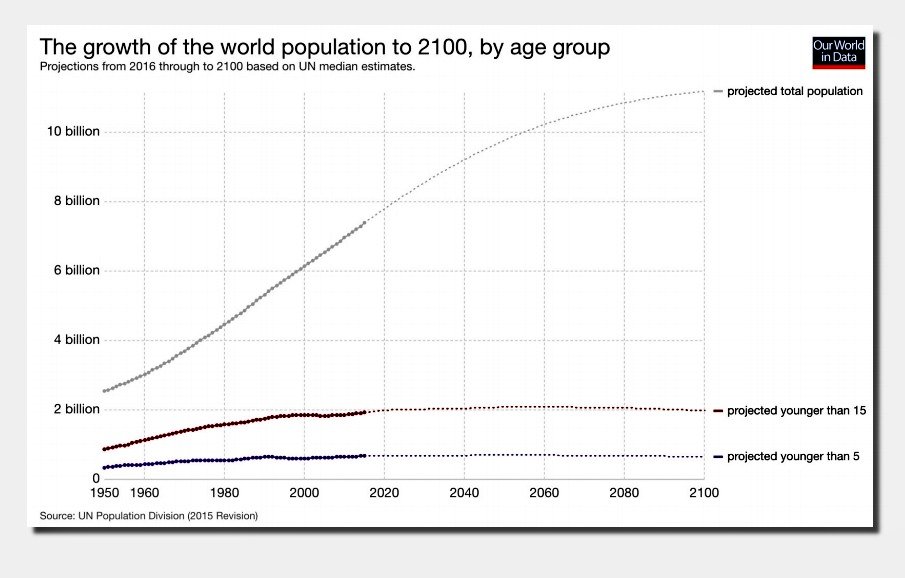
If the number of children no longer grows much, why is global population still projected to grow?
Because younger generations are larger than the earlier ones. So as older -smaller- cohorts die & younger grow up, total population grows even if fertility & mortality are unchanged
Because younger generations are larger than the earlier ones. So as older -smaller- cohorts die & younger grow up, total population grows even if fertility & mortality are unchanged

This is illustrated very well by Hans Rosling in his entertaining video called "Don't Panic -The Truth about Population"
Relevant section of the video starts at this link:
Relevant section of the video starts at this link:


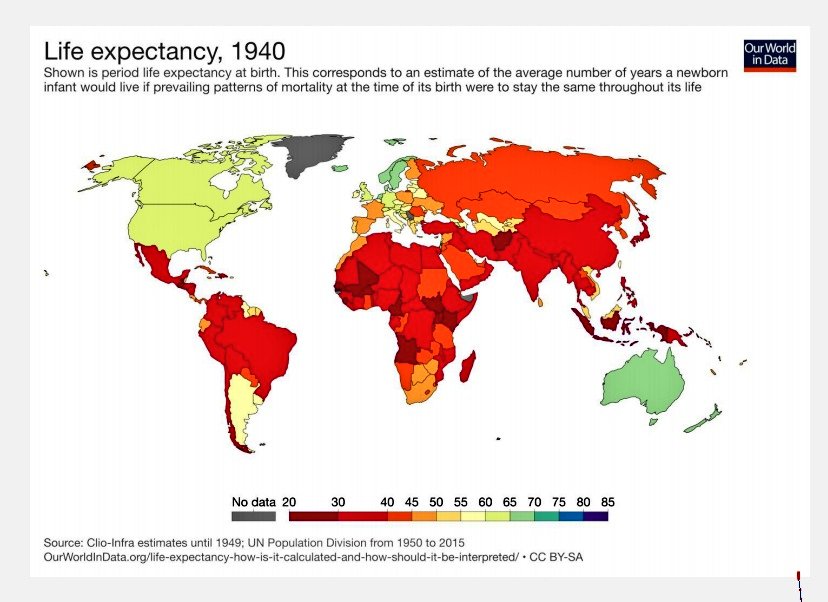
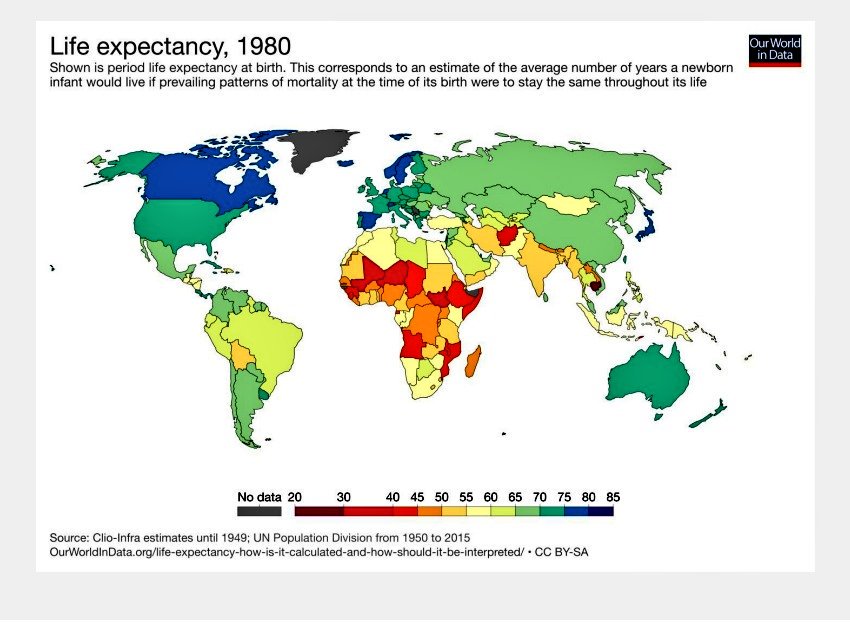
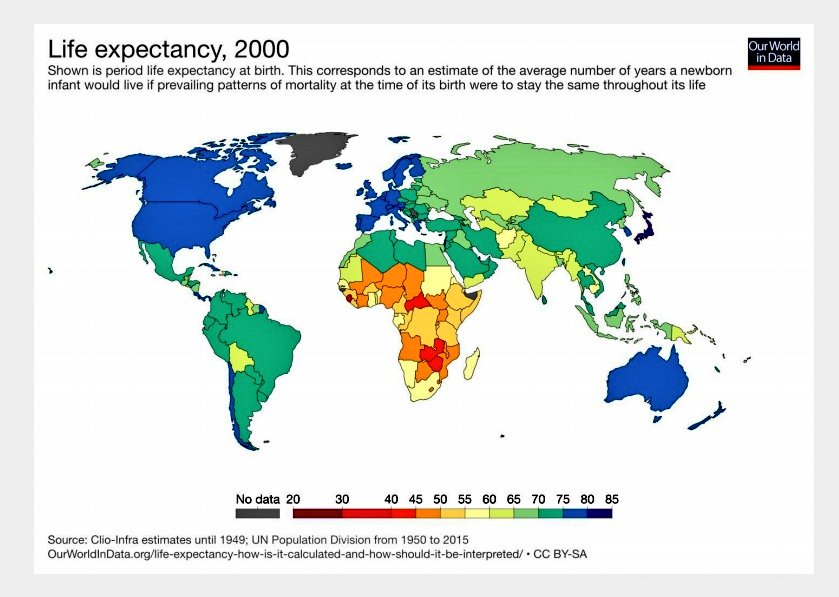
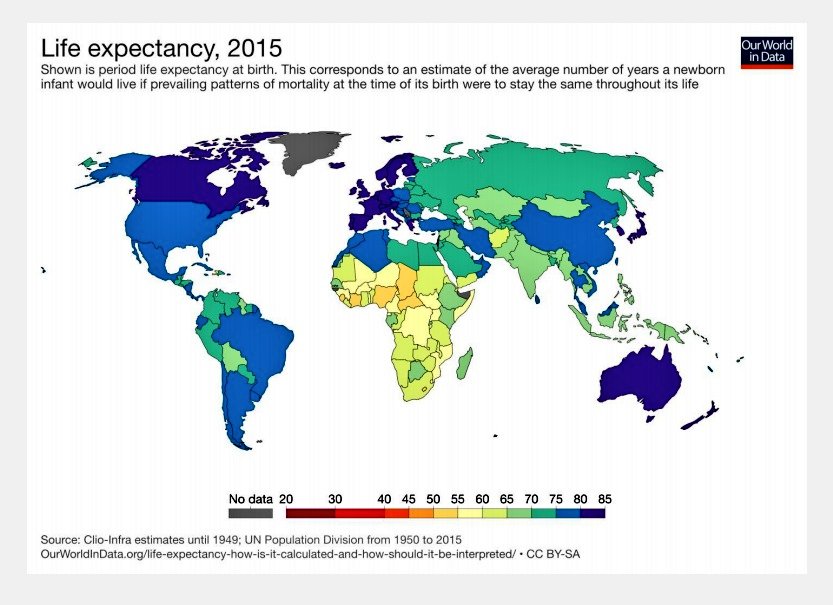
Life expectancy: amazing increase in all countries.
Here 1940, 1980, 2000, 2015:
Here 1940, 1980, 2000, 2015:
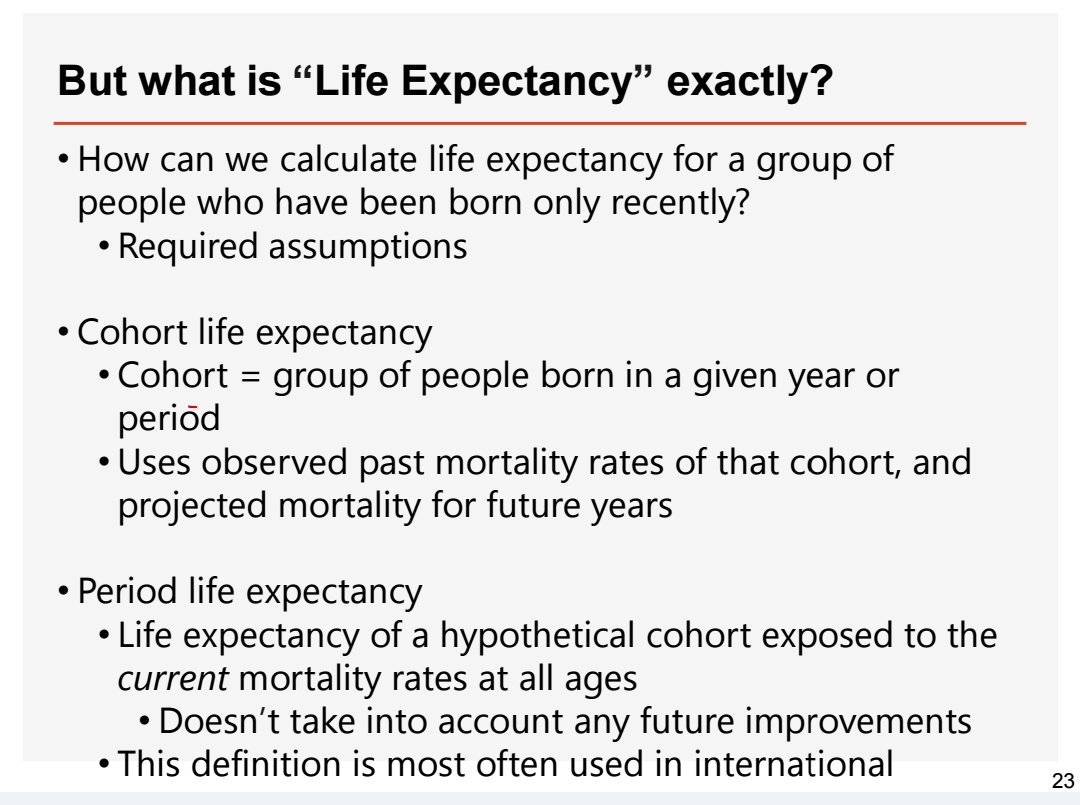
But what is life expectancy exactly?
Two different concepts:
"Cohort life expectancy" tries to predict how old current people will grow.
"Period life expectancy" = how old someone would be expected to grow if current mortality rates would hold through their entire life.
Two different concepts:
"Cohort life expectancy" tries to predict how old current people will grow.
"Period life expectancy" = how old someone would be expected to grow if current mortality rates would hold through their entire life.
Great explanations on what life expectancy exactly means: ourworldindata.org/life-expectanc…
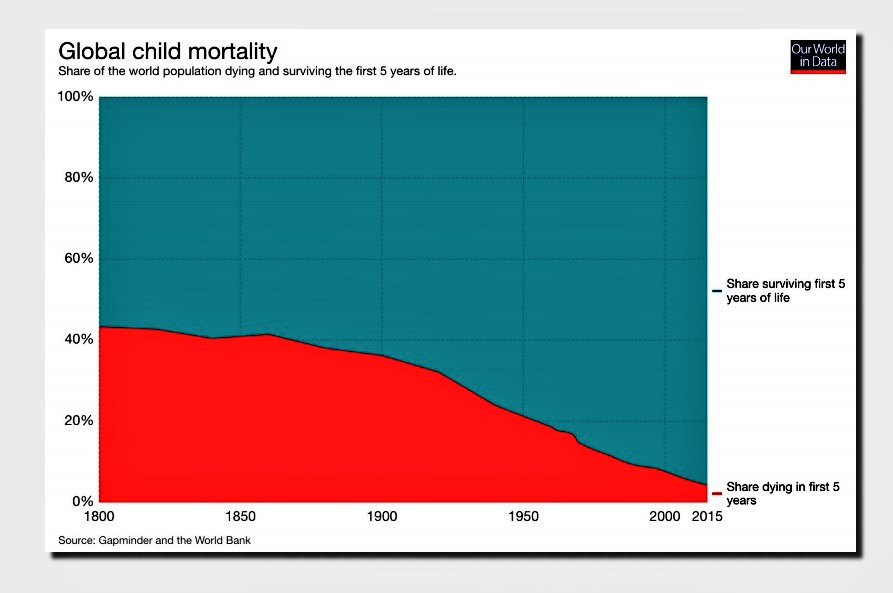
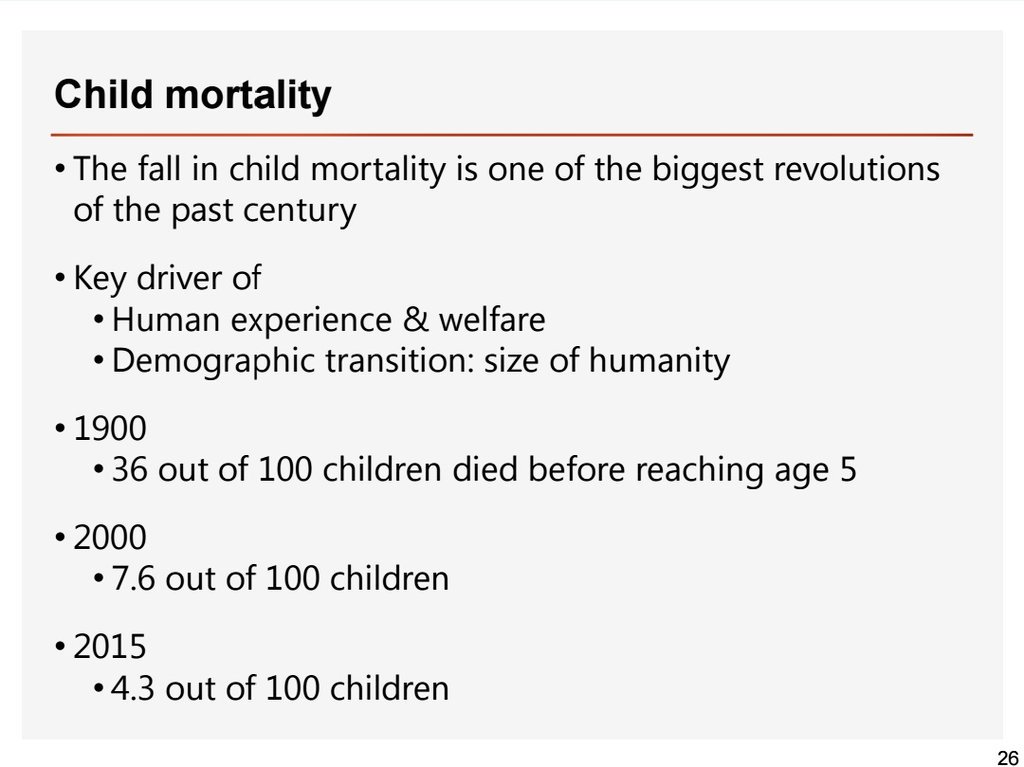
Child mortality has fallen dramatically in the last century:
1900: 36 out of 100 children died before reaching age 5
2000: 7.6 out of 100 children
2015: 4.3 out of 100 children
1900: 36 out of 100 children died before reaching age 5
2000: 7.6 out of 100 children
2015: 4.3 out of 100 children
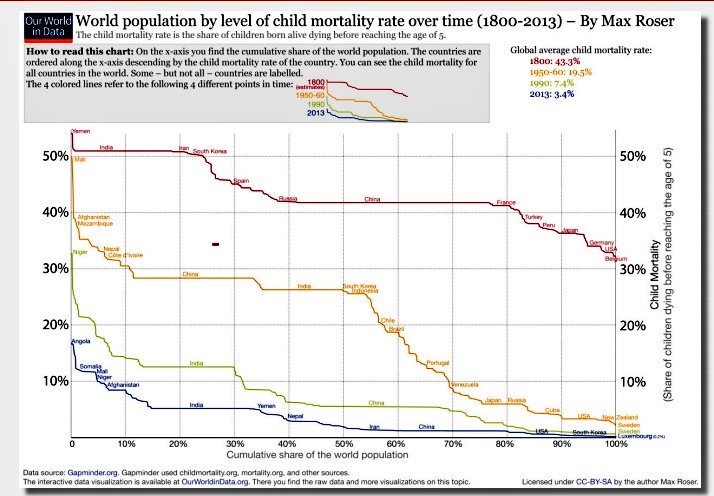
Child mortality by country in 1800, 1950/60, 1990, 2013:
- The country with the worst child mortality in 2013 (Angola), has half
the child mortality of the best country in 1800 (Belgium)
- Nepal in 2013 had about the same child mortality as Sweden in the
1950/60s
- The country with the worst child mortality in 2013 (Angola), has half
the child mortality of the best country in 1800 (Belgium)
- Nepal in 2013 had about the same child mortality as Sweden in the
1950/60s
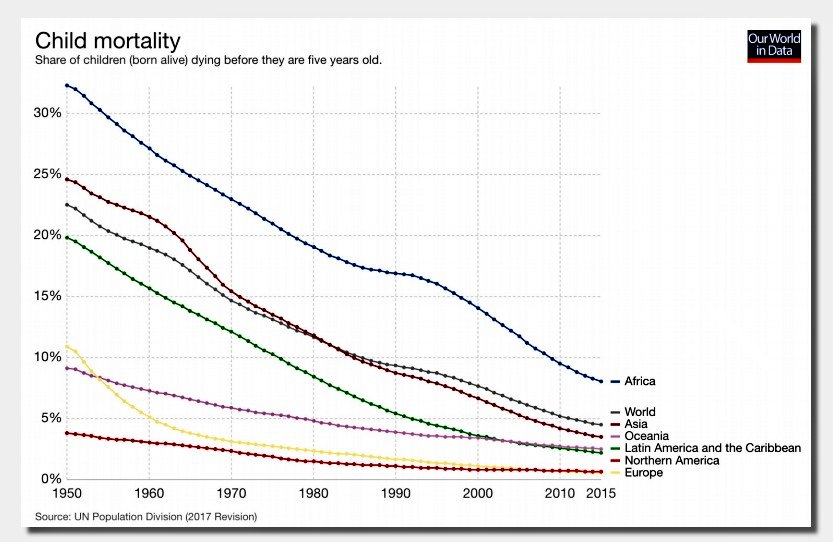
Child mortality has been decreasing drastically on all continents
Africa’s child mortality today is lower than Europe’s in 1950
Africa’s child mortality today is lower than Europe’s in 1950
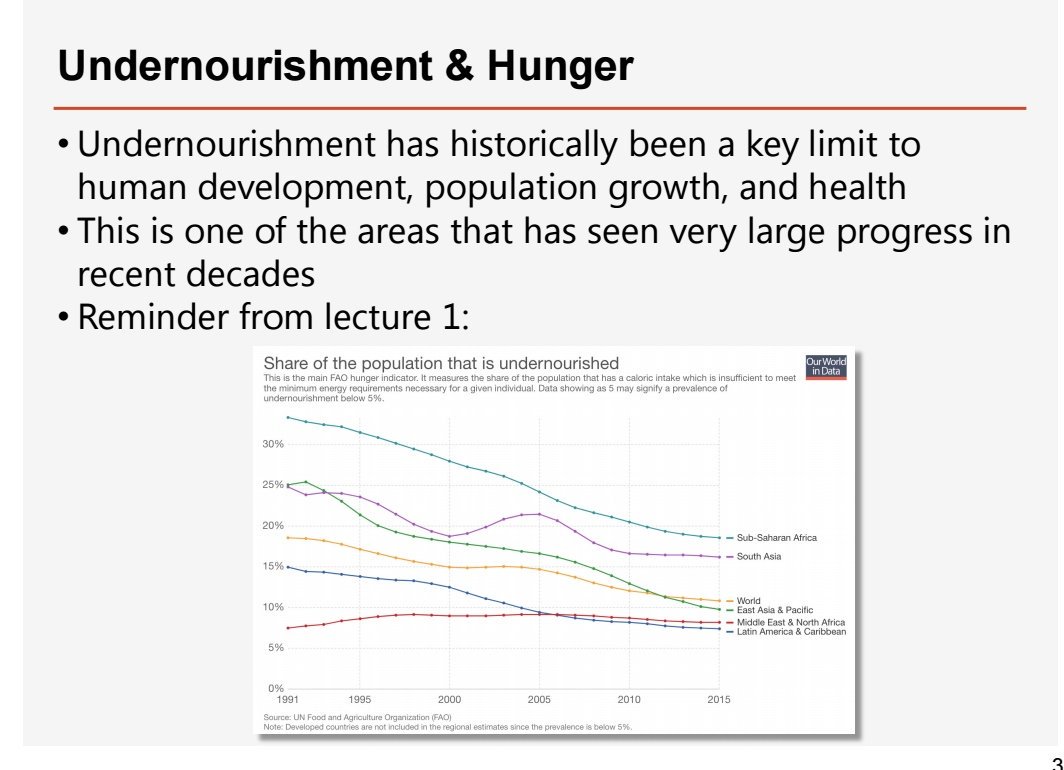
There has been a large decrease in undernourishment and hunger across the globe:
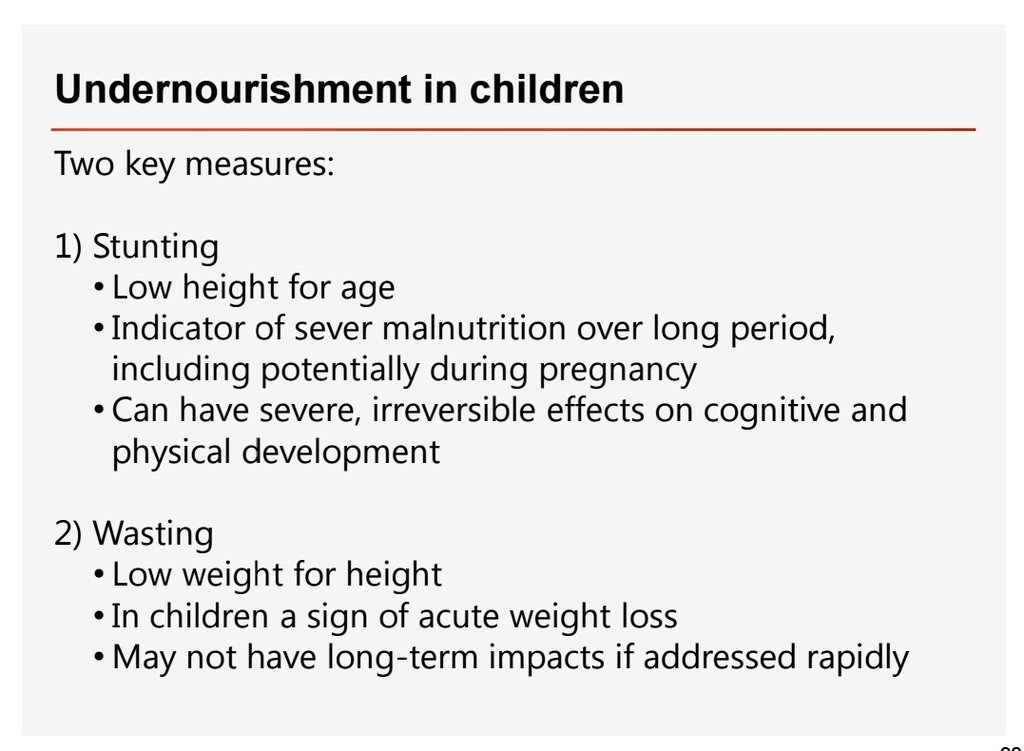
Undernourishment in children:
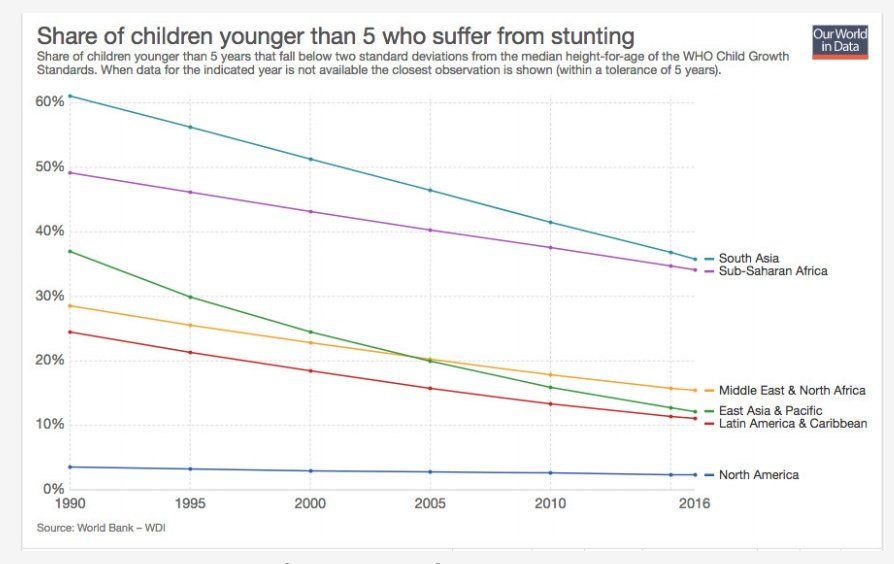
Stunting (children being too short for their age due to chronic undernourishment) has been falling significantly in the last 25 years, but is still remains high in many regions:
Stunting (children being too short for their age due to chronic undernourishment) has been falling significantly in the last 25 years, but is still remains high in many regions:
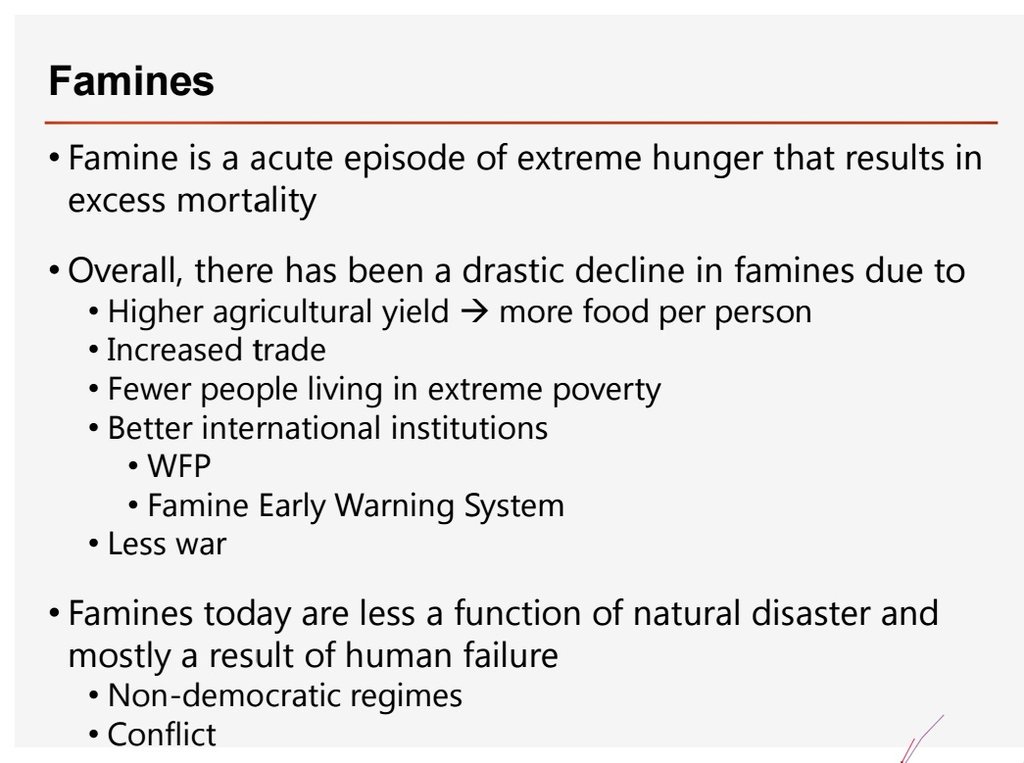
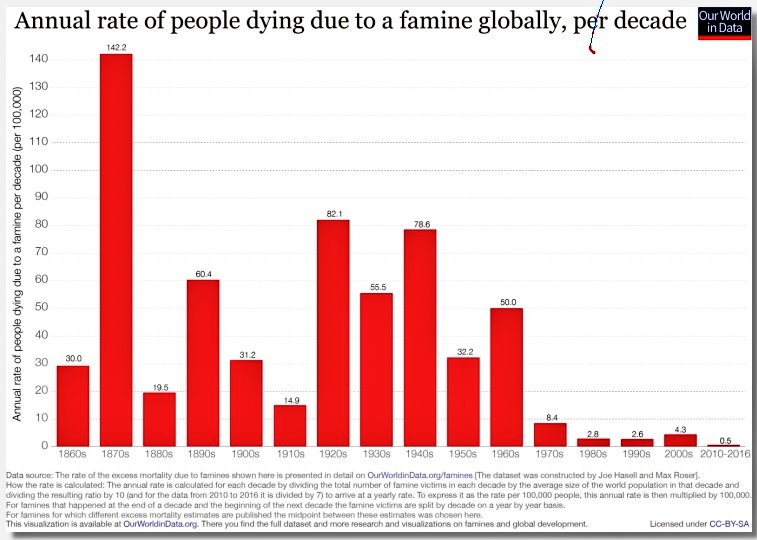
Famines: acute episodes of extreme hunger that result in excess mortality
Deaths from famines have fallen dramatically over the last century.
In today's world of abundant food, famines are less a function of natural disaster and mostly a result of human failure.
Deaths from famines have fallen dramatically over the last century.
In today's world of abundant food, famines are less a function of natural disaster and mostly a result of human failure.
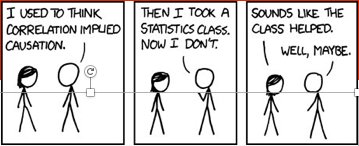
In the second half of the class we completely switched gears and turned to the discussion of impact evaluation.
How can we measure the effect of a policy change or an aid project in a way that shows causality, rather than correlation?
How can we measure the effect of a policy change or an aid project in a way that shows causality, rather than correlation?
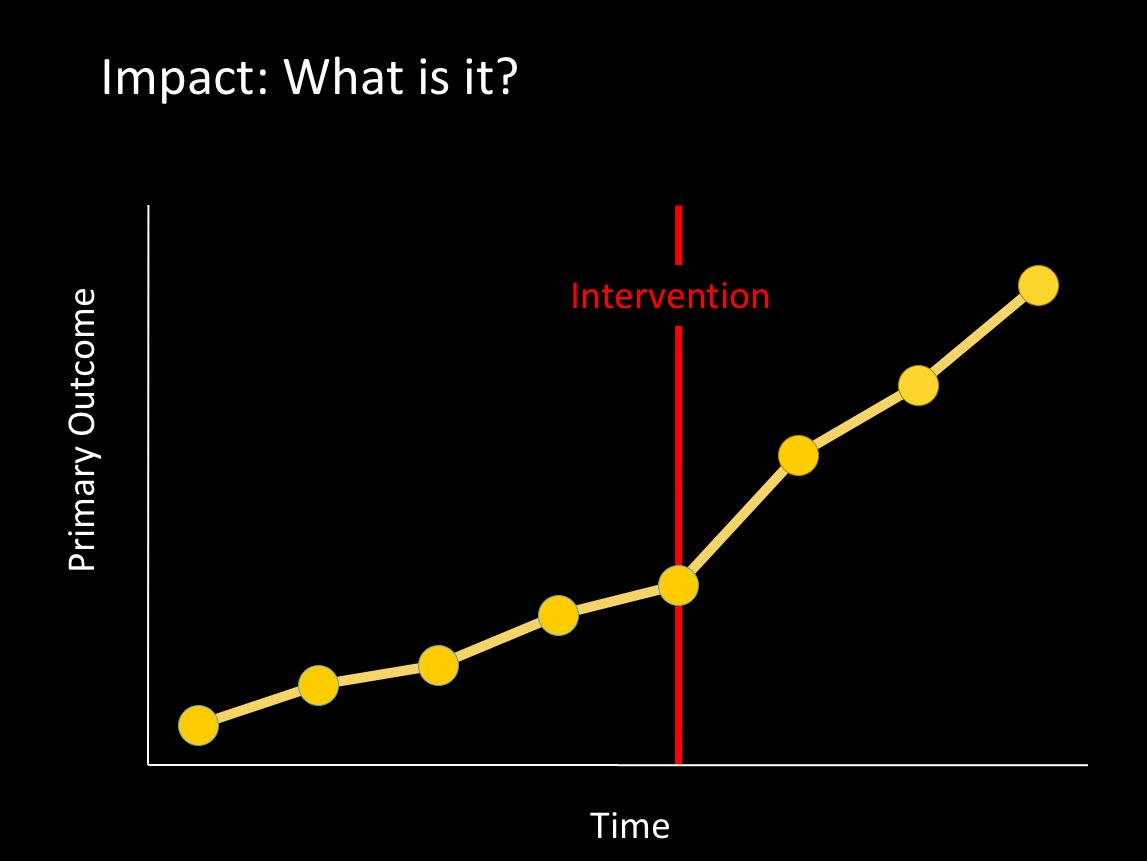
To start: If you look at the following figure, where the intervention line marks the beginning of a new program.
What was the impact of the program on the primary outcome? Did it lead to an increase or a decrease of the outcome?
What was the impact of the program on the primary outcome? Did it lead to an increase or a decrease of the outcome?
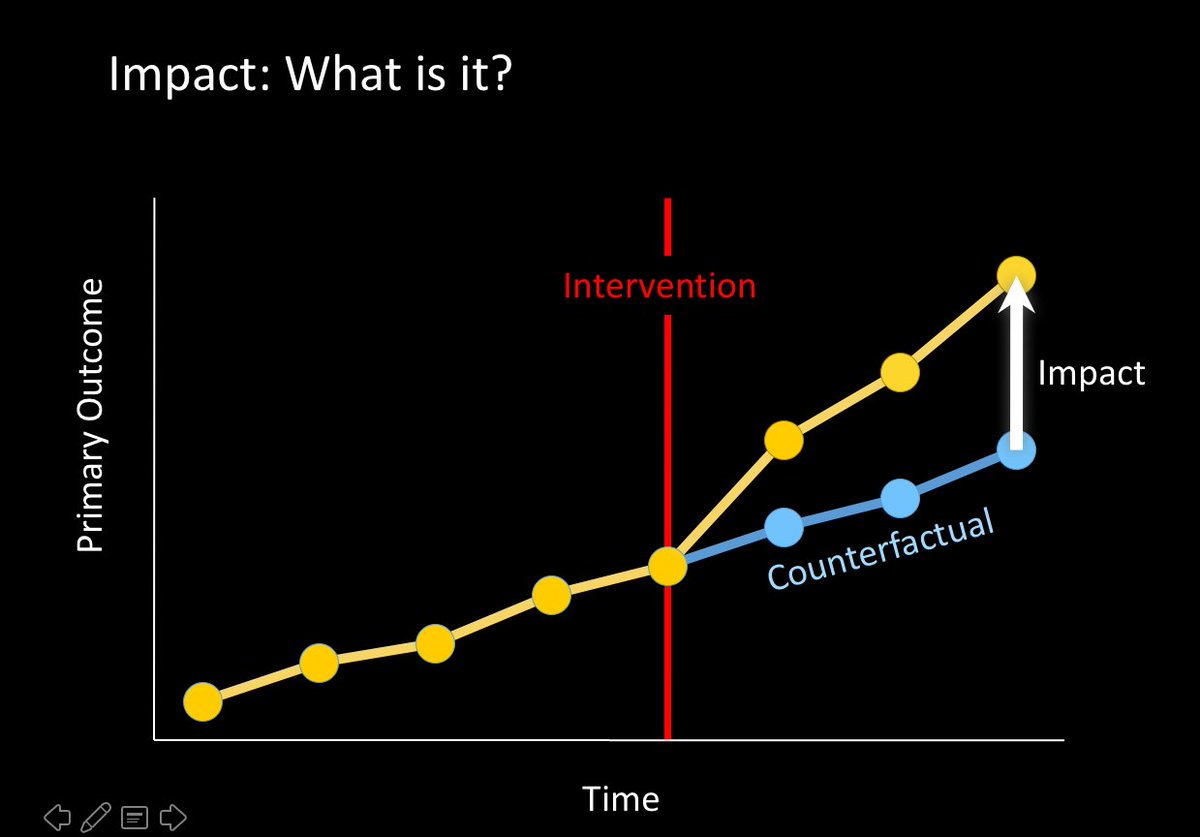
If you said it lead to an increase, the implicit assumption you made is that in the absence the intervention, the outcome would have continued to increase at the same trajectory as before (blue line below):
However, it is possible that without the program, the outcome would have changed for other reasons in a different direction:
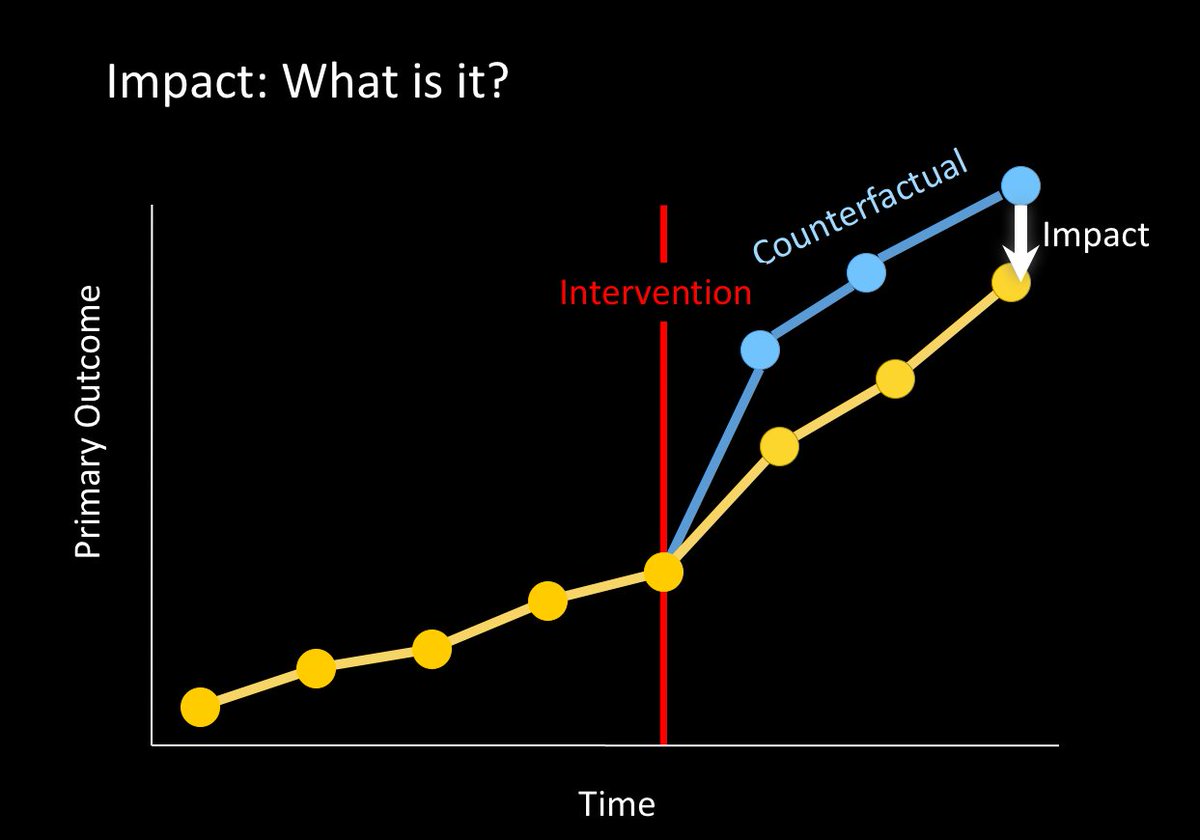
The situation that would have occurred if the intervention had not happened is called the "counterfactual".
To measure the impact, we need to capture the difference between what happened and what the counterfactual would have been.
Challenge: we don't know the counterfactual.
To measure the impact, we need to capture the difference between what happened and what the counterfactual would have been.
Challenge: we don't know the counterfactual.

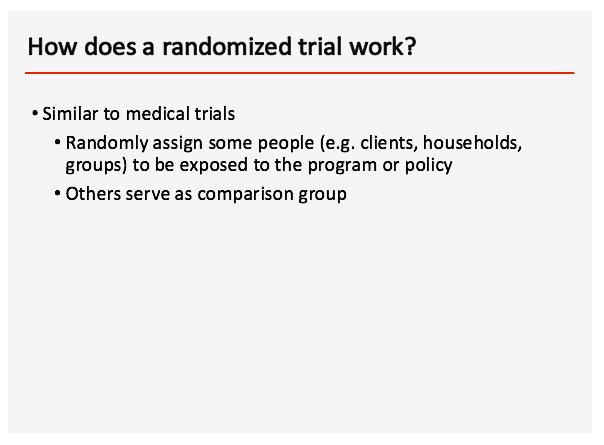
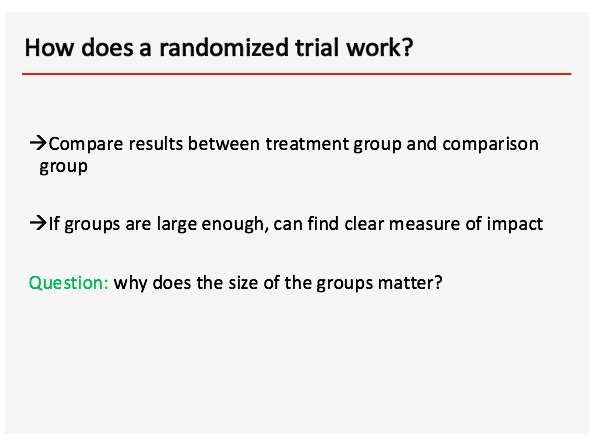
Randomized control trials (RCTs) are one of the clearest way to construct a measure of the counterfactual.
When people are assigned randomly to the treatment and the control group, then the control group can serve as an estimate of the counterfactual.
When people are assigned randomly to the treatment and the control group, then the control group can serve as an estimate of the counterfactual.
Esther Duflo has a great Ted Talk explaining RCTs and how they can contribute to measure the impact of (development) projects:
ted.com/talks/esther_d…
ted.com/talks/esther_d…

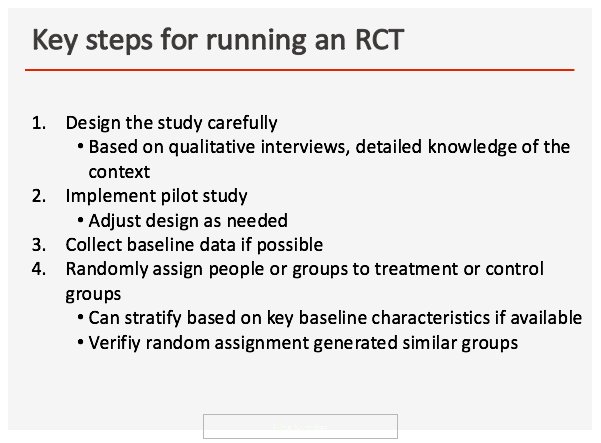
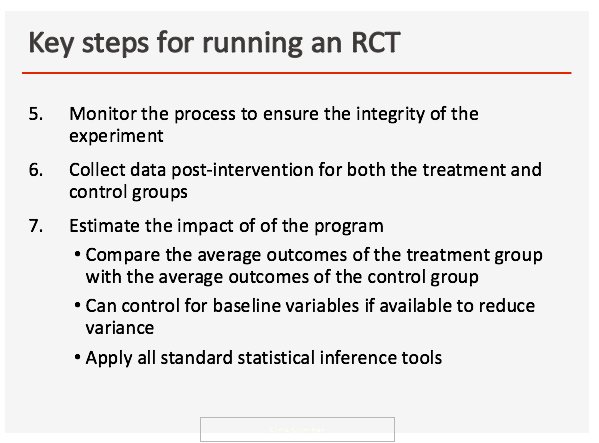
Key steps of RCTs:
In conclusion ;)
Great resources about RCTs on the @JPAL_Global website: povertyactionlab.org/research-resou…
Source for most of the global statistics shown in the thread: ourworldindata.org
Source for most of the global statistics shown in the thread: ourworldindata.org