GOOOOOOOOOOD TUESDAY MORNING, FRIENDS!!!! It's music day.
Today, we're going to be doing some music feature extraction based on Sunday's poll:
So My Heart Will Go On is the clear winner of the poll, despite the other two songs being much, much better. But, in the name of unbiased science, we'll analyze The People's Favourite AND I WON'T EVEN COMPLAIN EVEN.
Let's revisit this straight-up jam, shall we?:
Aaaahhhhhh, memories. The tin whistle solo! The belting! THE DRAMA.
(today is also going to contain MANY Céline Dion gifs. So be ready)
(today is also going to contain MANY Céline Dion gifs. So be ready)
If you want to code along now/later, you will need MatLab and MIR Toolbox:
jyu.fi/hytk/fi/laitok…
Paper here: dafx.labri.fr/main/papers/p2…
jyu.fi/hytk/fi/laitok…
Paper here: dafx.labri.fr/main/papers/p2…
If you'd rather not code, but still want to *play*, check out sonic visualiser:
sonicvisualiser.org
sonicvisualiser.org
RIGHT. Next, you'll need to go to the secure, underground vault where you keep your Céline Dion collection. Once you go through the retinal scan and voice identification protocols, join me back here.
LET'S BEGIN. First, what is feature extraction?
A piece of music is a multi-laaaaaayerd thing (again, CAKE.) that combines lots of information into a single package.
A piece of music is a multi-laaaaaayerd thing (again, CAKE.) that combines lots of information into a single package.
Feature extraction lets us isolate these pieces (features) and MAKE THEM FIGHT. STATISTICALLY.
SO. Using feature extraction tools (like MIR, Sonic Visualiser), we can extract low-level features, like amplitude
Another is spectral information. Sound is laaaaaayered (CAAAAAAKE) onto frequency bands. There's a really good primer here: newt.phys.unsw.edu.au/jw/sound.spect…
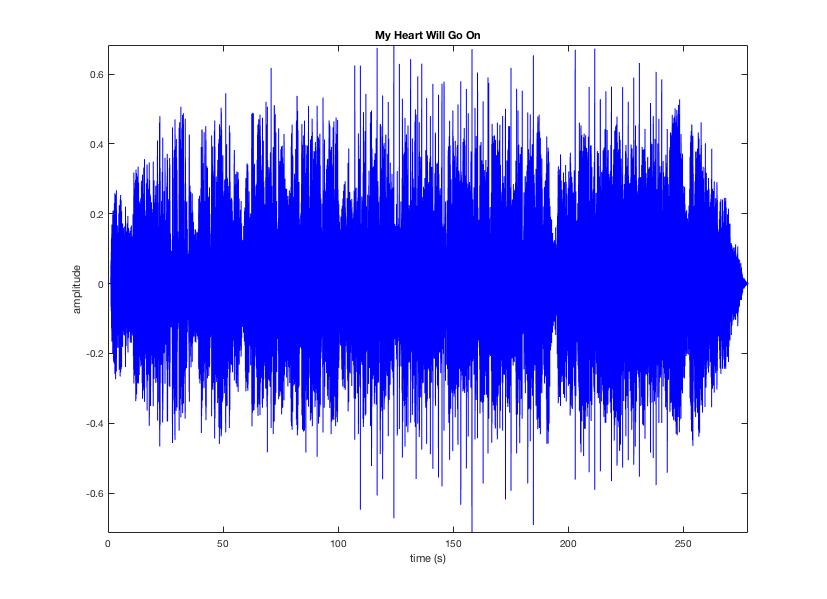
We'll start with the amplitude. The basic syntax is here in the editor, and I'll share a link with the code later on: 
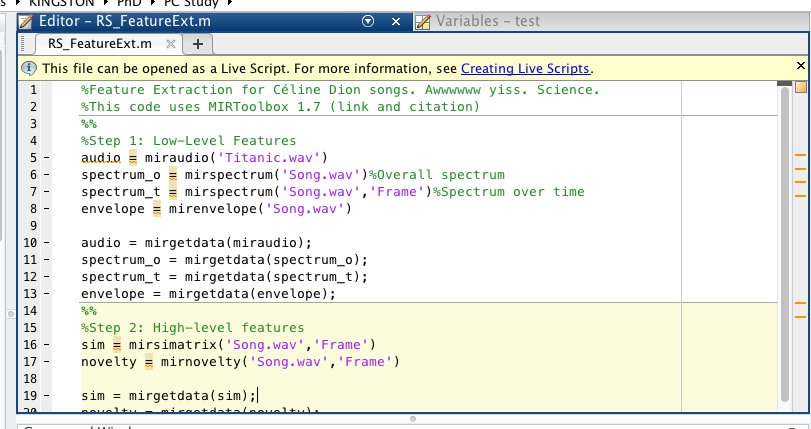
So miraudio('Titanic.wav') (if you're using mp3s, change the .wav to .mp3) returns the amplitude which, for my version, looks like this:
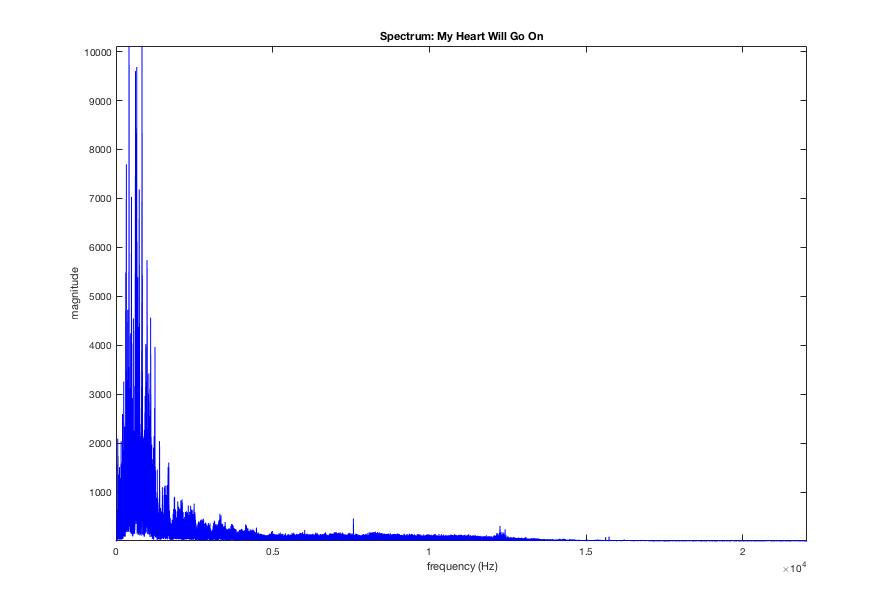
We can get the overall spectrum using mirspectrum('Titanic.wav') with frequency bands on the x axis, and magnitude on the y:
But if we want to see it over time (which we do), mirspectrum('Titanic.wav','Frame') will maintain the time series and give this heart-of-the-ocean-looking plot:
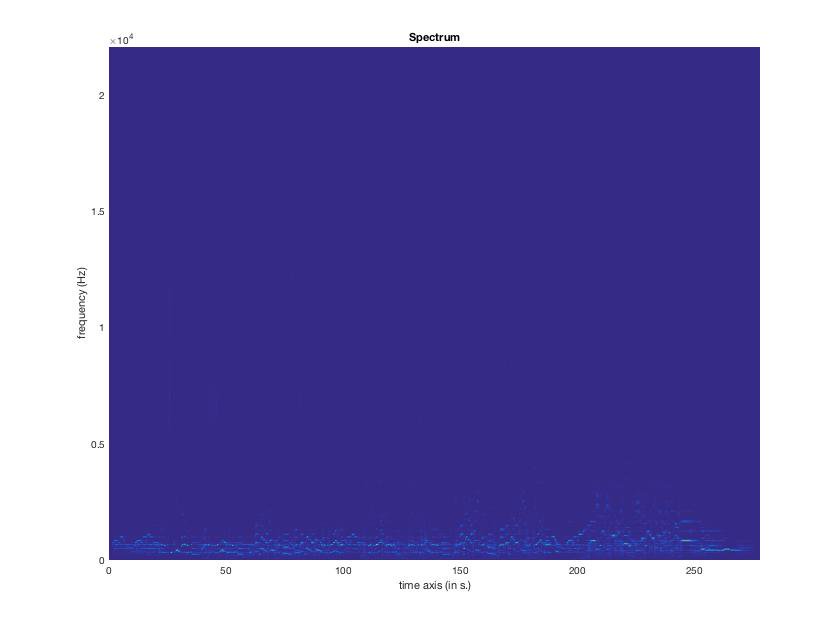
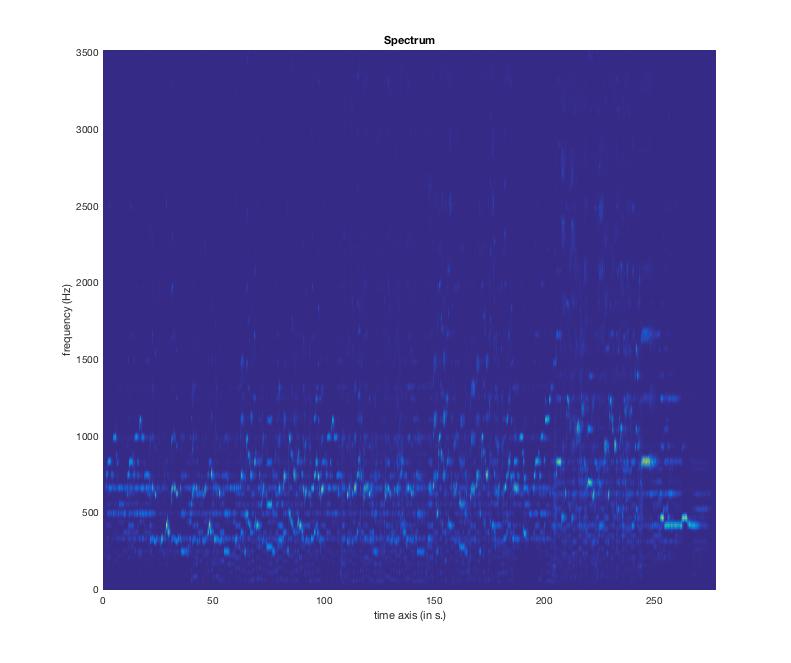
Left to its own devices, mir defaults to the sampling frequency, which is much higher than our *favourite* song. In the Overall spectrum plot, we can see that most of the activity is concentrated below 5000 HZ, so let's plot that (mirspectrum('Titanic.wav','Frame','Max',3500)
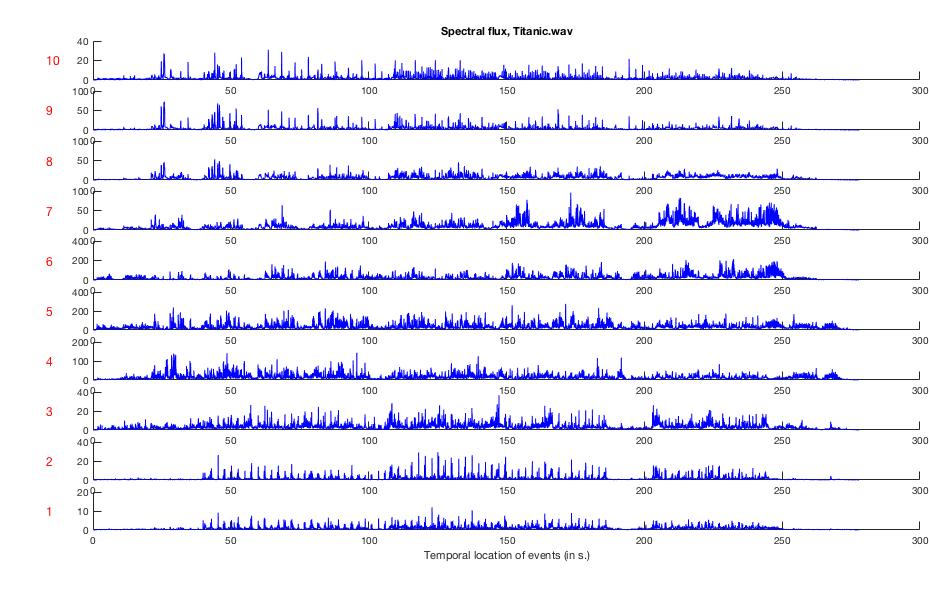
This is great (especially if you like blue), but for more clarity, here's the audio signal decomposed into frequency bands (mirflux('Titanic.wav','SubBand','Frame')):
Low-level features can be measured on existing scales, and don't rely on background information from the piece itself.
High-level features, on the other hand, rely on pooling information together FROM the song.
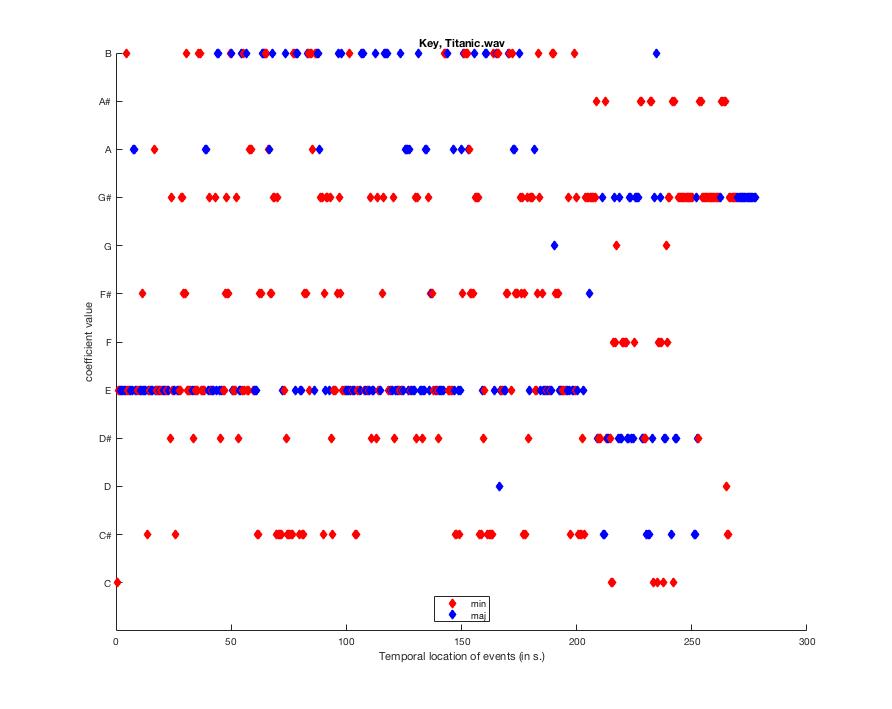
Things like key and tempo don't exist by themselves, but rely on comparisons within the piece. Here, we can compute the likelihood of a given key or tempo as the piece progresses. Here's the key concentrations over time (mirkey('Titanic.wav','Frame'):
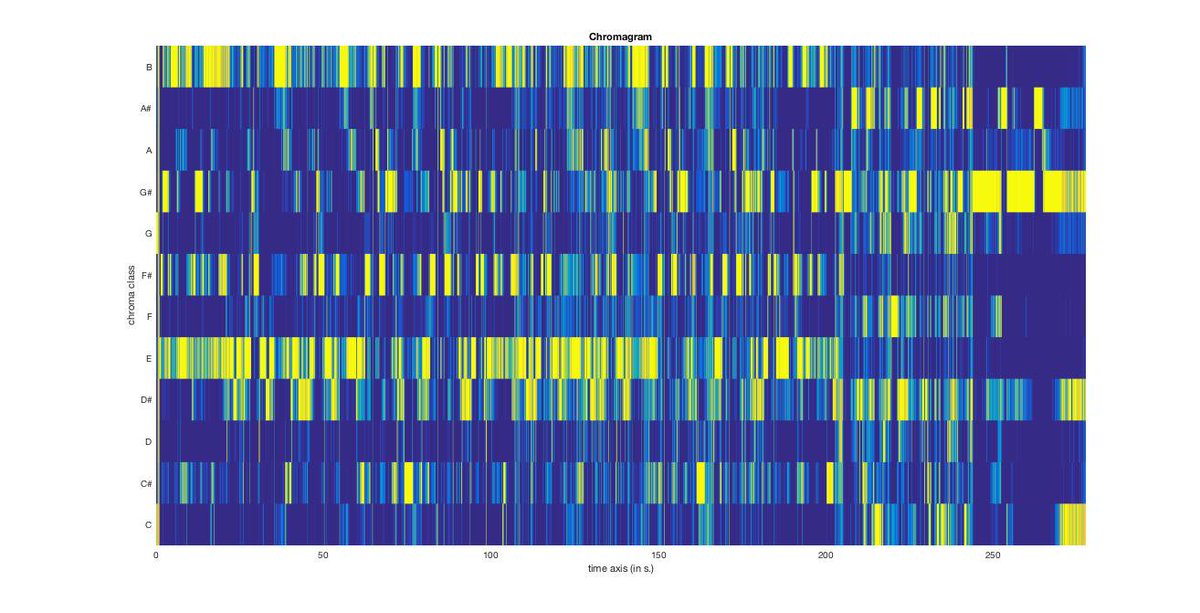
(if any music theory nerds want to break it down by pitch to see how they keay loadings come together, look at mirchromagram('Titanic.wav','Frame')):
Aaaaand one more! mirkeystrength will put these together over time as well:
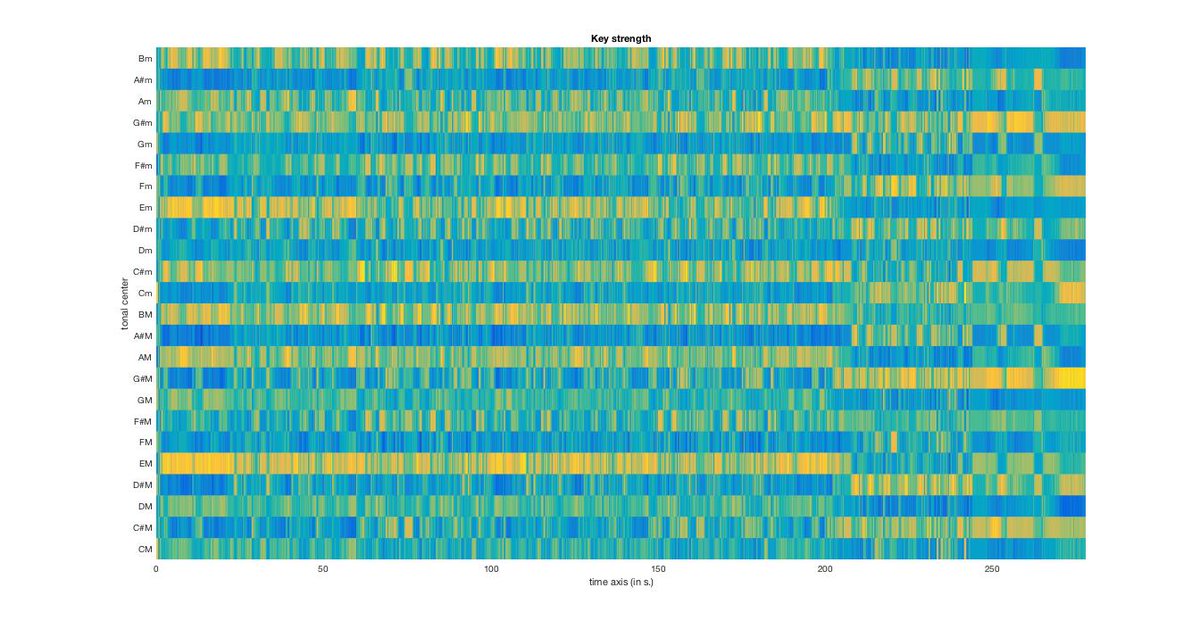
This is a lot of info, but the piece, overall, is in E-major. You know what else is MAJOR? CÉLINE DION.
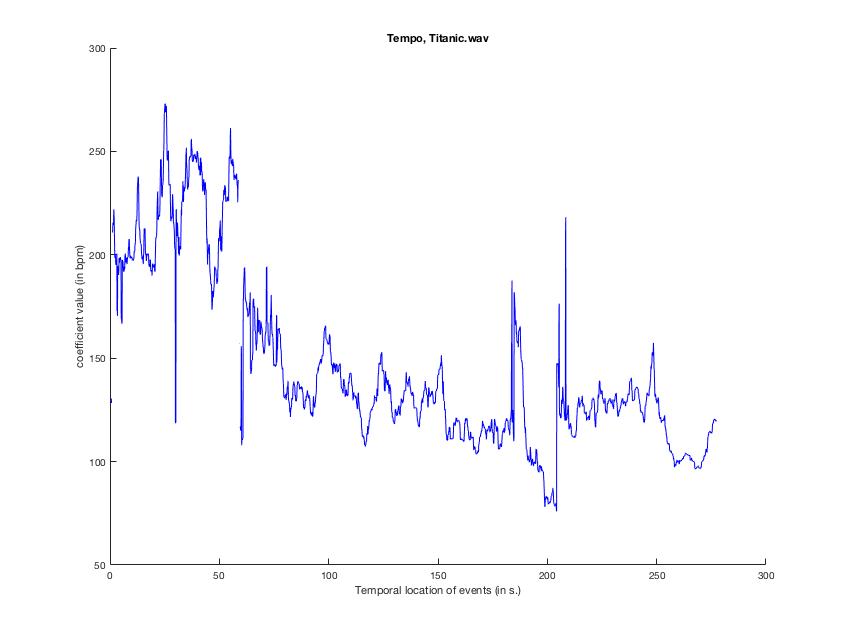
Another one is tempo. mirtempo('Titanic.wav') will give us the overall tempo (approx. 99bpm), but adding 'Frame' will let us see if La Dion is using any rubato. Which I pretty much guarantee she is.
(Rubato = playing with the tempo to make things DRAMATIC)
(Rubato = playing with the tempo to make things DRAMATIC)
HOLY RUBATO, FRENCH-CANADIAN BATMAN
This brings us to NOVELTY. Novelty is important in music because if something never changes, we either get bored and consciously stop listening, or it melts into the background subconsciously.
This isn't always bad - a lot of you on Sunday were talking about working with minimally distracting music. A highly predictable piece of music might be perfect to keep your monitoring systems working, but not too hard, which will allow you to focus on your work.
But, for this example, and popular music in general, novelty is usually considered good. So let's measure it!
First up, let's compute a similarity matrix. The similarity matrix compares moments in the music to earlier moments using multiple low- and high-level features.
If the value is high (warm colour), the moments are extremely similar. If the value is low, they are dissimilar. mirsimatrix('Titanic.wav') returns this glorious thing:
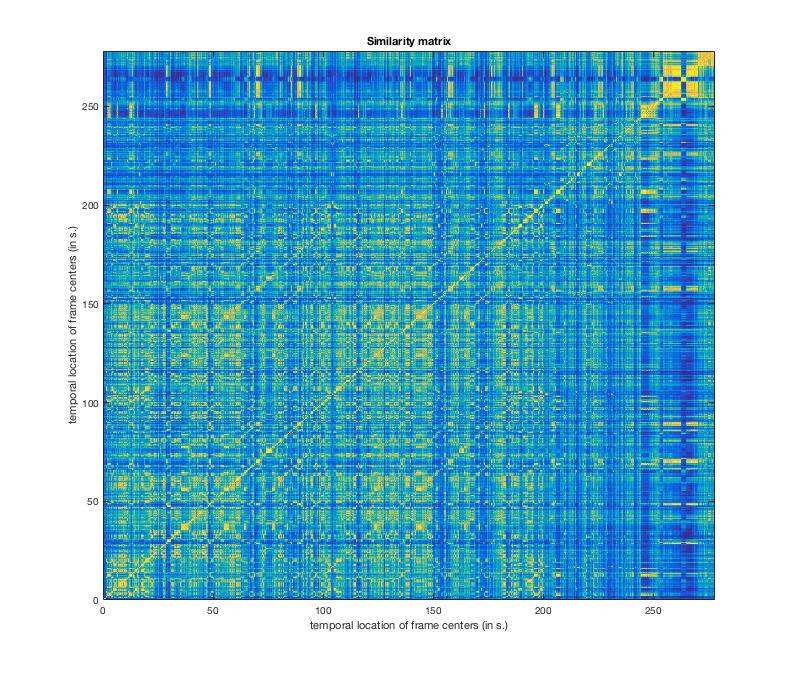
Let's look at longer time windows mirsimatrix('Titanic.wav','Frame',1) will give 1-second windows:
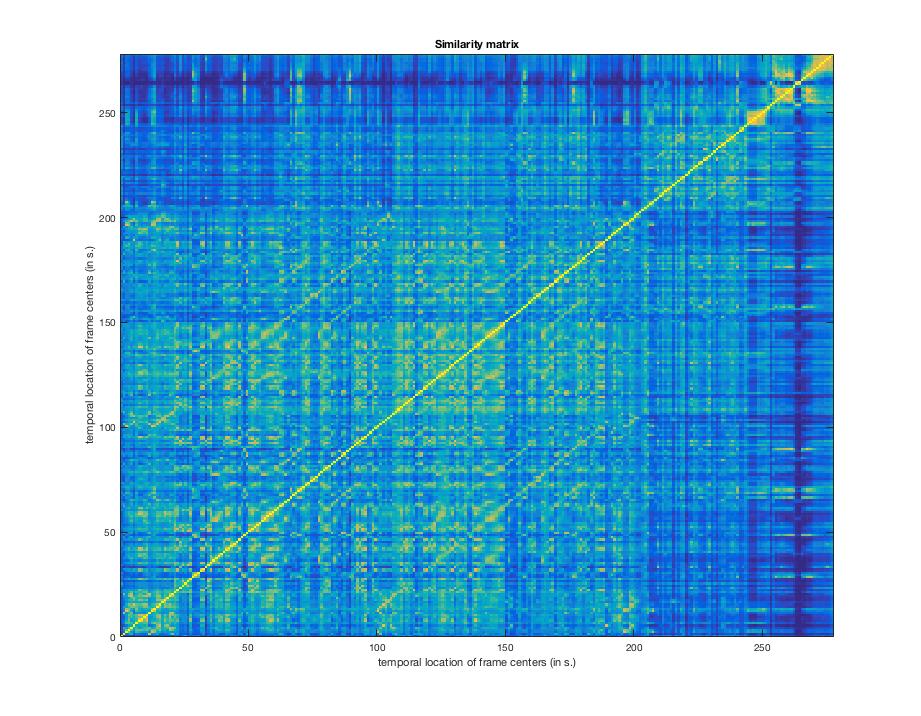
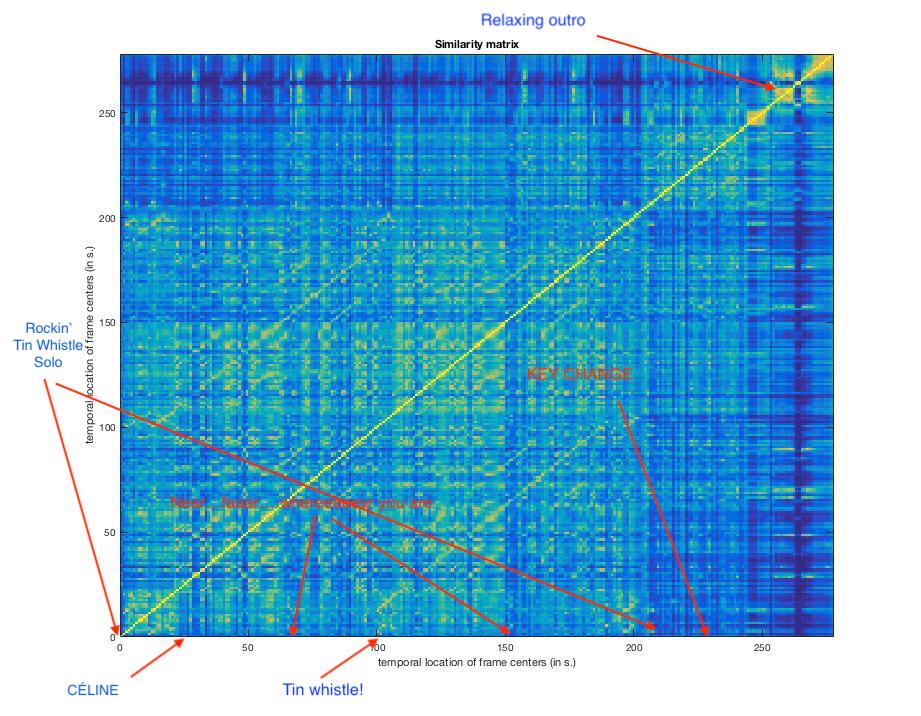
Listen to the song again (album version), and see if you can follow along with the matrix. The yellow squares are (music theoretically-speaking) themes, and the blue lines are changes in theme.
My comments are here...please add your own. SCIENCE.:
Those of you who do graph theory and network stuff, this is a network! Cool! Brain networks are calculated in similar ways using correlation, entropy, and other similarity measures.
I like the similarity matrices because it gives a nice visual of how the piece looks over time, and we can see patterns related to different phrases in the music. Also, they look like fancy carpets I would 10000% want in my Céline Dion listening chamber.
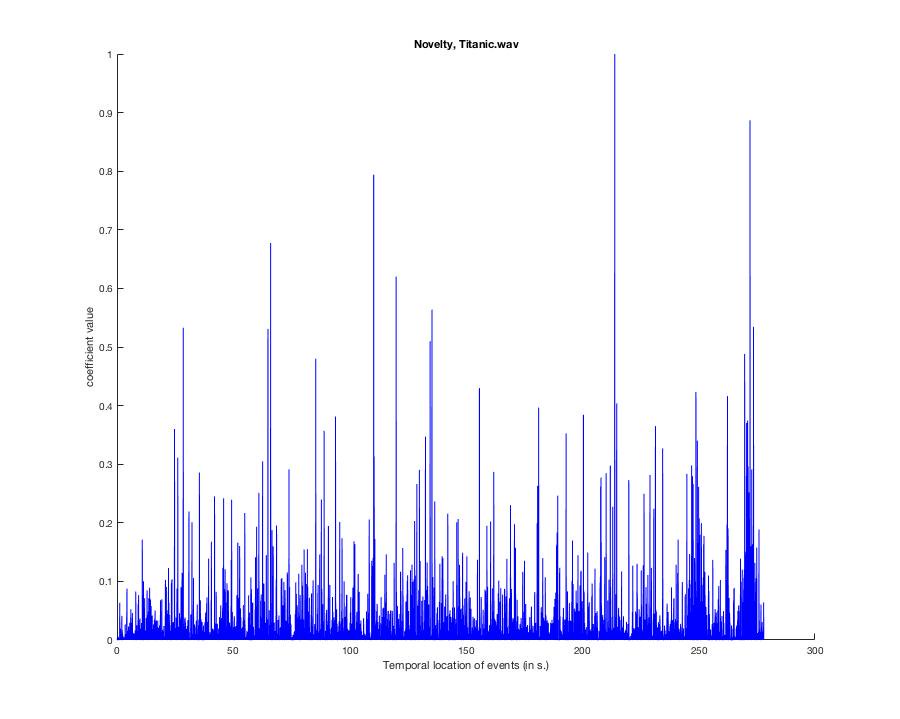
Next up is novelty. Novelty is a lot like entropy in that it measures predictability. High values in novelty/entropy = high unpredictibility, so you can think of it as THE CHAOS COEFFICIENT. Or something.
mirnovelty for a piece this long takes a while (it computes multiple features along the time series using sliding windows), so let's take a wee break to talk about musical features more generally.
These features produce interesting visualizations that can help us see the music, but they also provide numerical data that we can use to quantify the music. mirgetdata([insert your variable here]) will extract the numerical information from any of the things we've done so far.
From here, we can get onto STATS. DON'T GIVE UP ON ME. Stats are cool.
Sorry for the delays - we are experiencing technical difficulties. RIGHT. STATS. With the features extracted you can start comparing between pieces.
If pieces differ based on things like spectral profile, amplitude (for more on this, talk to @ahjteam about loudness war), recording engineers could change how music is recorded to take advantage of the features common to the most popular songs.
If pieces differ on higher-order features, like key, tempo, novelty, etc., that could change the way songs are written. If you can't guess, this is an extremely lucrative area of work for people in commercial entertainment.
One crucial element here is whether people *actually* like the songs, so data could be inferred from things like views/clicks on streaming websites, sales, shares on social media, etc.
(musical features are also used on streaming services and websites like YouTube to predict what you might like based on stuff you've already listened to)
But features can't account for everything. Genre is a tricky thing to predict. A personal example is Pandora. I listen to a lot of bagpipe music (PIPES RULE 🤘) and the pipe music I like is characterized by high-tempo, high-frequency songs that don't modulate.
You know what else does that? Hair metal. A surf music. I'd get a lot of suggestions for epic stadium bands and Surfing tunes because they share similar profiles.
So other information is also needed. Humans are very good at categorizing songs by genre, but machines, not so much (yet).
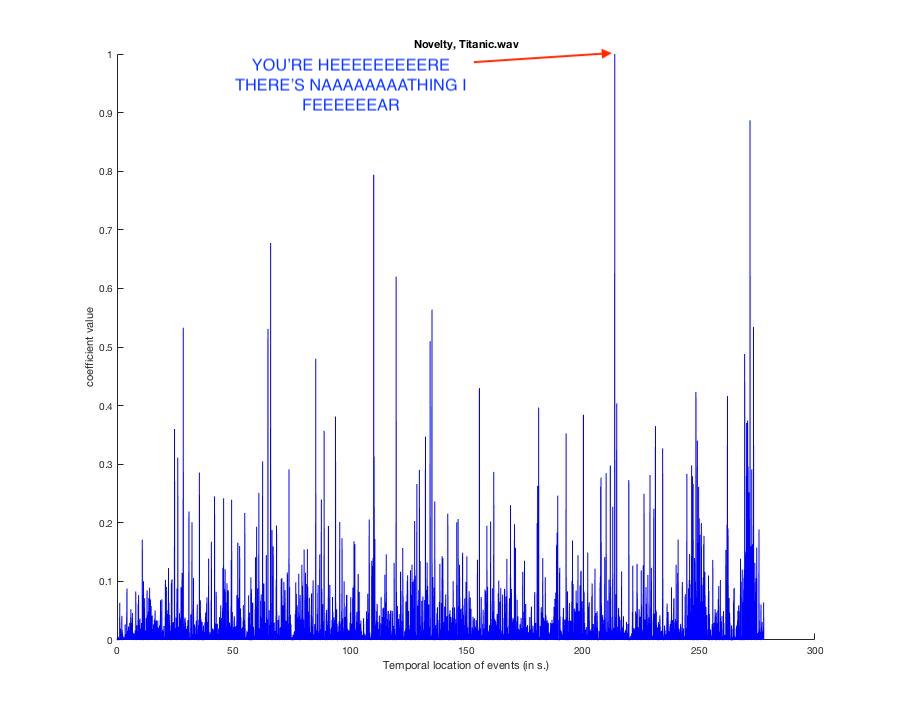
BACK TO MY HEART WILL GO ON. Here's the novelty graph. You can listen to the piece again to see if you agree. First rule of music research: be prepared to listen to a song until you never want to listen to it again. Then listen to it again.
Annotated version:
While YET MORE SCRIPTS are running, let's go back to the survey question and think about how you would define EPICNESS in music. It's likely going to be a higher-order feature (like novelty) based on a combination of high- and low-level musical features.
We would need to develop some kind of epicness scale, collect data from people rating many excerpts on how epic they are (and are not). This gives us a measure that we can then use features to predict. Which means one thing and one thing only. A BUNCH OF REGRESSIONS!!!!
Regression is a statistical measure that lets us look at variable X (in our case, epicness ratings) and huck predictors at it to see what, if anything will stick. This will let us build a model of things that we can use to predict epicness in pieces that weren't initially tested.
The regression will return a coefficient (called a beta-weight) that shows you how much of the variance in the epicness scores was created by the feature in question.
Another possibility is correlation. With correlation, you can see if higher/lower ratings are significantly linked to higher/lower feature values. BUT. Correlation cannot tell you causality. I refer you to this amazing website:
tylervigen.com/spurious-corre…
tylervigen.com/spurious-corre…
Another thing to keep in mind is over-fitting. We can feature extract until the cows come home, but if we put too many features in the mix, we'll end up with a model that's really good at predicting our existing data, but not flexible enough to work with other data.
After that, we could select *new* pieces based on our model, test them with *new* participants, and see how well our predictions match up with actual human ratings. SCIENCE.
ANOTHER cool thing we could do is use the features from the music to look at brain data. I shared this video on Sunday, and these areas were sourced based on music feature extraction by the amazing scientists and music wizards @MusicPsychJYU:
Brain data isn't that different from an audio signal, and peaks and troughs in the audio signal can be linked to similar patterns in the brain data.
THIS opens up a whole bunch of exciting options. You can look for differences between prof/novice/non-musicians, explore differences related to age, and, what I'm MOST excited about, you can see how/if the patterns change with clinical populations.
As we discussed on Sunday, music is an enjoyable stimulus that's accessible to individuals who may have neurodegenerative diseases, communicative impairments, brain injury, etc.
Where music is such a complex thing to process, seeing how music-evoked brain activity does/does not change between healthy individuals and clinical populations would tell us a lot about these illnesses without relying on measures that may not be possible (eg questionnaires)
...while using a fun stimulus that most people enjoy
Recent studies have identified the network of brain areas involved in listening to naturalistic music (aka music that hasn't been filtered/processed by the researchers) with healthy adults. This baseline is vital, because it gives us a baseline.
...but not like this
I'm work in Alzheimer's, so this healthy adult baseline will let me investigate the music listening network with healthy older adults. Brain activity patterns change as we age, and figuring out what's normal over the lifespan is essential.
Normative age-matched data can then be used as a more reliable baseline to start studying the music listening network in individuals with Alzheimer's disease
So that's an introduction to music feature extraction, possibilities, math, tangents, and the genius of Céline Dion.
Also, if the government of Québec want to give us des grands dollaires to quantify this further, mes MDs sont ouverts.
Rest of thread here:
Code is here: play with it!
drive.google.com/open?id=1h6uly…
drive.google.com/open?id=1h6uly…