
Have you ever seen a single-arm, non-randomized study with survival curves showing one subgroup of patients doing better the other and thought "wow, that drug must improve survival in that responding subgroup"?
Learned from @VinayPrasadMD about this type of analysis, called "survival by tumor response". Paper published in JCO in 1983 by Anderson et al. describes this in detail.
Although I don't consider myself a #Tweetorialist, I will try a mini-#Tweetorial summarizing this paper and hope that @ProfDFrancis approves
The usual statistical method for analyzing survival by response involves seperating patients into 2 groups - those that respond to drug and those that don't. You might already see the problem here
In order to be classified as a "responder" you need to have some time to respond. Meaning, you need to live long enough to be classified as a responder - this is called "guarantee time" and is at least as long as "time to first response"
On the other hand, such a time does not exist for the "nonresponders". In fact, if a "nonresponder" dies before a response occurs, they are classified as "nonresponders" even if they were to respond to the drug
The conclusion then that "responders" live longer than "nonresponders" is the
same as saying that those patients who live until they respond survive longer than those who do not.
same as saying that those patients who live until they respond survive longer than those who do not.
Another method to calculate this to try and reduce bias is to compare overall survival among "nonresponders" to survival from time to response among "responders" (i.e. eliminate "guarantee time" from the equation which is already favoring improved survival among "responders")
The problem with this method is that death rate for "nonresponders" will still be overestimated + all the ones who eventually respond will be eliminated from the group.
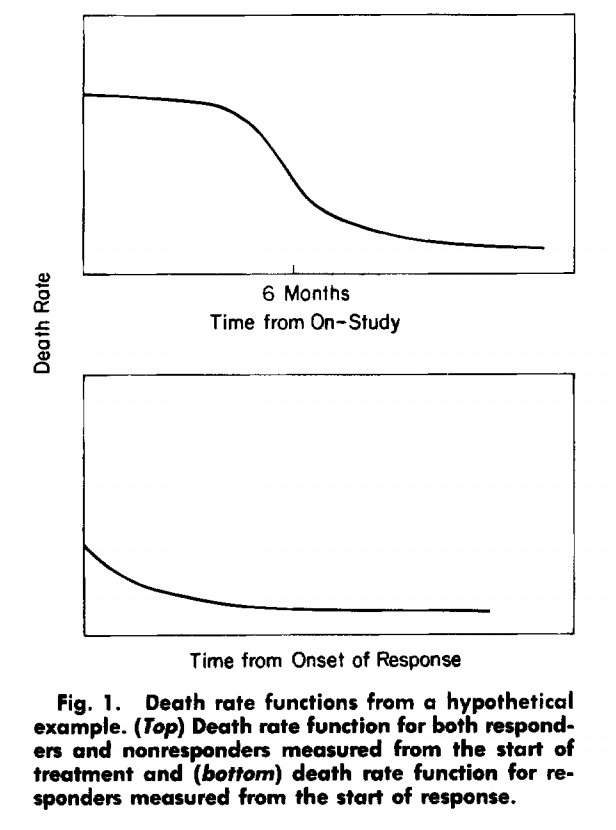
Suppose death rates for "responders" and "nonresponders" are equal and are shown in this figure. Thus, the risk of death for a patient at each time point does not depend on response. 
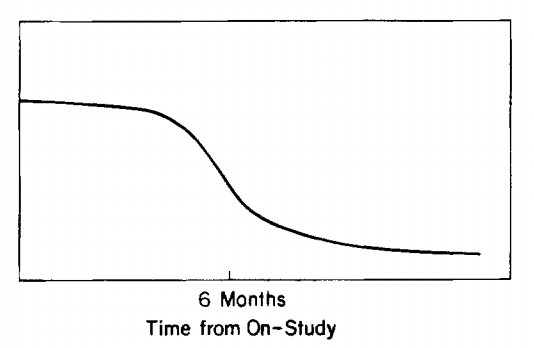
If most pts acheive a reponse at 6 months then risk of death for "responders" will look like the top figure. If survival is measured from response, then it will look like the bottom figure = death rate for "responders" looks lower than "nonresponders" but is in fact the same.
Both these methods (the usual method and the modification) are clearly biased.
Other statistical methods can be used to minimize bias, but none provide data on the effectiveness of the treatment in improving survival. I will not get into these other methods because I will probably make a mistake and @ADAlthousePhD will scold me
Suppose the appropriate methods are used (e.g. Mantel-Byar, Landmark), how do we interpret the data?
1/ Just because a statistically significant difference in survival exists between "responders" and "nonresponders" does not mean that reponse causes longer survival. Response may be a mechanism to select a favorable subgroup of patients with different disease and host biology.
Meaning, "responders" may survive longer than "nonresponders", not because of an effect of response on survival, but because response serves to identify patients with pretreatment characteristics which favor longer survival.
2/ Response rates at a prespecified "landmark" time can be prognostic (i.e. poor prognosis pts will be treated differently than those with a favorable prognosis).
In this situation, the p value of the comparison may be useful to indicate whether the difference in prognosis between "responders" and "nonresponders"
as defined at the landmark time is merely due to random variations or is statistically significant.
as defined at the landmark time is merely due to random variations or is statistically significant.
The issue of causality is irrelevant when response is used in this way as a prognostic factor.
3/ You cannot substitute response analysis for a comparative one produced by a randomized trial. Often, "responders" are seen as the group which received the benefit of treatment and "nonresponders" as the group which did not benefit - viewed as a "control" group.
The statistical comparison of "responders" to "nonresponders" is thus presented as a surrogate for an analysis of treated versus untreated patients
So when looking at a paper that uses an analysis of survival by response:
First, make sure the usual and modification methods of calculating survival are not used. The results are biased, the statistical test of significance is invalid, and the conclusions are misleading.
First, make sure the usual and modification methods of calculating survival are not used. The results are biased, the statistical test of significance is invalid, and the conclusions are misleading.
Second, it is wrong to imply that longer survival for responders proves that the treatment being studied is effective, or that a more aggressive treatment is warranted.
Third, in every paper which contains a comparison of survival by response, the reason such a comparison is being presented should be clearly stated, and the limitation of the comparison should be discussed.
Ok, I'm done. Should I ever attempt a #Tweetorial again?


