1/n (Long thread: Understanding patterns in the reporting of workplace sexual harassment) In one of my previous tweets, I posted data from the 2017 Cornell National Survey, which showed that Liberal females were sig. more likely...
2/n ..to report experiences of workplace sexual harassment than their conservative counterparts (the graph is below for anyone that missed it). 

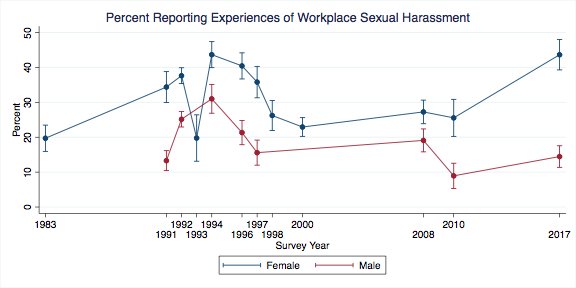
Since then, I've gathered enough data to generate a longitudinal trend line to determine a) whether the high % of women reporting sexual harassment is historically unprecedented; and b) whether liberal women are consistently more likely to report experiences of sexual harassment
Beginning with A, the data I currated suggests that the 2017 rate is actually the highest it's been at since the early-to-mid 90s (which, incidentally, coincides with a period of media-salient sexual harassment scandals--more on this later)
And, with respect to B, with few exceptions, the data does indeed show that Liberals report workplace sexual harassment at significantly higher rates than moderates and conservatives


6/n So what drives these patterns? I'll begin with B since it's somewhat easier to answer/less speculatory. Some of you suggested a 'racial differences' account; i.e. Blacks are more likely identify as liberal (which is wrong btw) and experience more sexual harassment than Whites
7/n In the end, this hypothesis is unsupported. In fact, White women are significantly more likely to report experiences of sexual harassment than blacks and hispanics, respectively.


8/n Another hypothesis held that liberals simply have a much lower/unforgiving bar for what they deem to be 'sexual harassment'. The only data I found that speaks to this question is from 1991. With this caveat in mind, the data proves unsupportive. Specifically, there are no..


9/n...sig. differences in the types of behaviors that members of each ideol group perceive as sexual harassment.While it's possible that the definition of 'sexual harassment' has since been stretched beyond recognition.I'll for now deem this hypothesis 'inconclusive' at best.
10/n A third hypothesis posits that the disparity is a function of educational and thus occupational differences: i.e. Female liberals are more educated and thus are more likely to land 'white-collar jobs' in male-dominated environments.
11/n And yet, the data shows female liberals 'out-reporting' conservatives at every education level. Of course, it's still possible that they still enter into different occupational environments. But some additional data I've recently found (which I'll share below) suggests...

12/n that occupation isn't the primary driver of these disparities.
13/n A fourth hypothesis is that insofar as they tend to be more promiscuous and sexually 'open', Female liberals are more likely to be perceived as 'easy' and are thus a greater object of sexual attention. I hazard to say that this hypothesis finds strong support in the data..
14/n First, female liberals consistently report having more male sex partners than their moderate and conservative counterparts (ignore the jump in moderates for the years 04 and 06--small n)

15/n And, as it happens, the number of sexual partners significantly positively predicts the probability of reporting sexual harassment in a controlled logit model. Unsurprisingly, there's even an ideology x sex partners interaction, with the effects of the latter becoming..


16/n ...stronger at the liberal end of the 7-point ideology scale. Importantly, this finding is not an artifact of the GSS data: I managed to replicate it on data from the 1992 National Health and Social Survey

17/n But # of sex partners is not the whole (and not even the most provocative part of the) story. I suspect I'll be accused of 'blaming the victim' for showing this, but that's not my intent. It's simply what the data shows. And what it shows is that...
18/n ...the more one finds rape sexually appealing, the more likely one is to report an experience of workplace sexual harassment. Alcohol consumption and having a job where one is often alone with others is also somewhat predictive, but number of sex partners + rape appeal..


19/n ..appear to be doing most of the heavy lifting. Unfortunately, this data set did not include a measure of ideology; but the effects of Party ID point in the 'Democratic' direction.
20/n Now for the more speculatory part of the picture, which relates to the surge in (especially liberal) women reporting sexual harassment in 2017. As I see it, there are several possibilities. The first is that, after declining and leveling off in the 2000s...
21/n there was a surge in workplace sexual harassment over the past few years. While I can't definitively exclude this possibility, I don't find any support for it in the data...
22/n Specifically, while the GSS surveys from which this data was derived only asked about sexual harassment over the previous 12 months (and hence weren't incorporated into the longitudinal graph above), they do show a slight but significant decline in % of women reporting it..

..between the years 2002 and 2014 (6.1%-->3.8%), the latter of which obviously falls just three years before the 2017 surge.
23/n Thus, if there was a genuine increase in workplace sexual harassment in the intervening years, it had to have been a dramatic and sudden crescendoe. While not impossible, I do find it implausible (for instance, why was the rate of lifetime sexual harassment sig. lower in..
24/ 2010? Did half the female population wake up in 2017 and begin recollecting repressed memories of sexual harassment?)
25/ Another possibility, which is somewhat vague theoretically, relates to something I briefly mentioned earlier: rates of reporting are at least partly responsive to the salience of sexual harassment in the media. For instance, why did reporting rates spike in the 90s?
26/ Because the Anita Hill-Clarence Thomas (and soon after Clinton) sexual harassment scandals captured significant media attention. And, as it happens, the data does show that closely following the controversy in the media significantly positively predicts the odds of reporting


27/ In the ANES 1992, we find a similar effect for those who follow gender-related issues in the media.


28/n By 2000, however, when the media salience presumably tapered off, we no longer observe this effect

29/n While I couldn't find any data to plug the gaps for the intervening years, the reporting rates for the years 2000, 2008 and 2010 did not significantly differ (remaining in the 20-30% range).
30/n Fast forward now to the period surrounding the rise of Trump and the 2016 election. Due, at least in part, to his perceived misogynistic behavior/rhetoric towards women (including claims of sexual harassment), sexual harassment and gender issues were thrust back into..
31/ the foreground. Unfortunately, the CNSS 2017 survey didn't feature any items that explicitly ask about media consumption; nor did it ask any questions about Trump's rhetoric about/behavior towards women. However, it did ask respondents...
32/n whether they've heard of the term 'redpill', which, as many of you likely know, was coined/popularized on social media a few years back and is likely familiar to those who tune into online social justice discourse.
33/n And, lo and behold, those who've heard of the term are significantly more likely to have reported experiences of workplace sexual harassment than those that didn't.


34/n Coincidently (or not), I also found that search interest in 'redpill' and 'sexual harassment' jumped together in 2017.

35/n Of course, it's more than plausible that the causal arrow runs in the other direction: i.e. those who experience workplace sexual harassment are more likely to follow news about gender-related issues. And it's because I can't exclude this possibility that I deemed...
36/ this account somewhat suspect. That said, considering some of the other media effects I've previously shared in the context of perceived discrimination, I do think it's at least plausible that the salience...
37/ of the issue in the media--and the concomitant prestige/sympathy that awaits those who claim victimhood--produces these sudden upward swings in the reporting base rate.
38/n In other words, the 'real' base rate--i.e. what the average person (i.e. not gender studies majors) would consider sexual harassment--has remained relatively stable overtime, but...
39/n that media salience + the broadening of the definition (to include even innocuous or unintended behavior) encourages a kind of 'identity-expressive'/socially motivated reporting.
40/n To be sure, I've yet to exhaust the range of possibilities here and I could be completely wrong about all of this. For instance, perhaps the 'surge' is simply the result of 'noisy' data. Or, alternatively, perhaps it's a matter of subtle variations in question-wording.
41/n For those that are interested, I collated all of the sexual harassment items (labeled by year) into a single google document. With a couple of exceptions, the wording of the items is generally similar if not the same. drive.google.com/open?id=1VLMa4…. But you be the judge.
42/n To sum up: when it comes to accounting for ideological disparities in reporting, the data strongly points to sexual promiscuity/licentiousness (# sex partners, 'sexual kinkiness') as important explanatory variables...
43/n On the other hand, when it comes to explaining variations in reporting over time, the data does not allow me to draw any strong causal inferences. That said, it is *consistent* with a media/context effect. Anything beyond that is purely speculatory.
44/n Look forward to hearing your questions and comments! End of Thread.
Just to add: for those that'd like to replicate, all of the data is open access and can be readily downloaded here ropercenter.cornell.edu/polls/dataset-… (with the exception of the ANES & NHSS data, which can be found here icpsr.umich.edu/icpsrweb/).
The specific surveys I used are listed in the google doc I posted in one of the tweets above.