,
12 tweets,
3 min read
Read on Twitter
Can we increase public spending in the UK without increasing tax on the average worker? What do international comparisons say? My final thread on this theme:
We can plot the level of public spending in each country against the overall direct tax burden on employees - the "tax wedge". Crudely, if a country is above the trend line then the average employee is getting a better deal - more public spending without paying more tax. 

Another way to view it: divide the world into quadrants:
1. countries w/ higher public spending than the UK/lower average tax om employees
2. higher public spending/higher tax
3. lower public spending/lower tax
4. lower public spending/higher tax
There is nobody in quadrant 1
1. countries w/ higher public spending than the UK/lower average tax om employees
2. higher public spending/higher tax
3. lower public spending/lower tax
4. lower public spending/higher tax
There is nobody in quadrant 1
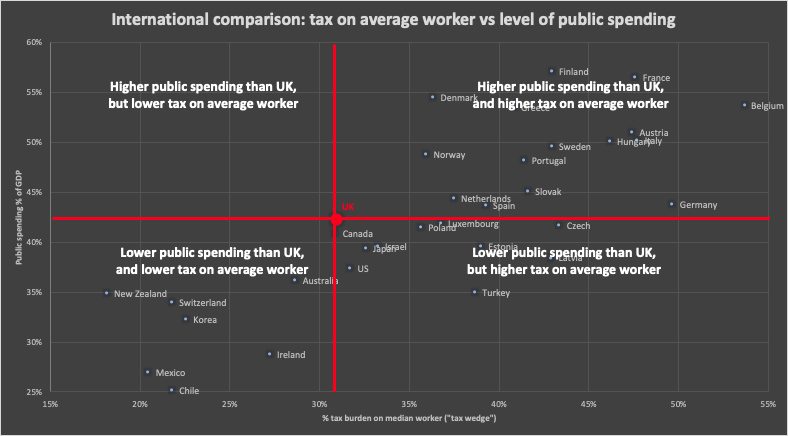
So, to answer the question, can we increase public spending without increasing tax on the average worker? Only if we can achieve something no other country in the world has achieved.
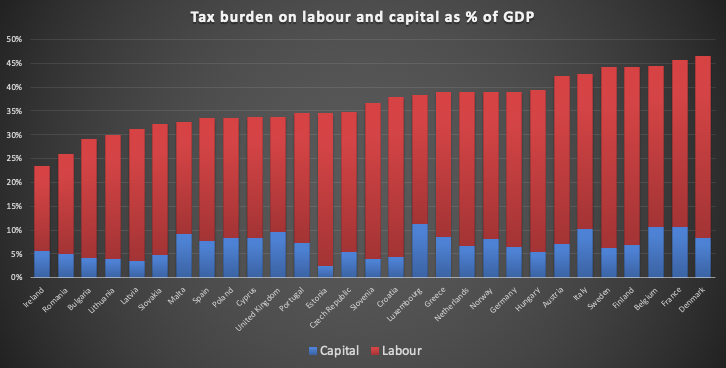
This isn't an argument against raising more tax from business/capital, from the rich/the wealthy. Equity and sheer politics say you should, if you're increasing tax on the average worker.
But if you want significantly expanded public services then - unless you think the UK can be an exception - you can't *just* tax "other people".
And here's where all this takes me: there's an argument to be won that it's worth everyone paying more tax for better public services. The depressing thing is how rarely anyone makes that argument in the public debate.
Source: the numbers are pulled straight from the 2017 OECD tax wedge table data.oecd.org/tax/tax-wedge.… and OECD general government spending table data.oecd.org/gga/general-go… (covering national, state and local government)
Caveat: the numbers are slightly different from my previous posts - they were my calculations based on 2016 OECD and EU data of average wages and tax levels. The advantage of that approach was that I could break down into income tax/social security/employer social security.
Bound to be methodological differences between me and the OECD (e.g. I was looking at average worker; OECD looks at average single worker). And I could have made mistakes. I'd trust the tax wedge figures more than mine.
Caveat 2: I suggested the other day that the tax wedge figures included VAT. That is not correct - it's just direct tax. Would love to incorporate VAT and other indirect taxes if someone can point to a suitable data source.
Caveat 3: pay no attention to the Irish dot - Irish GDP is inflated by profit-shifting, and so the "real" level of public spending will be higher.