,
29 tweets,
12 min read
Read on Twitter
Good morning ☀️! Last wk of June & you know what that means, we're onto H2 next wk.
Econ data for this wk: 🇩🇪 IFO, 🇺🇸 New home sales & consumer confidence & durable goods order; 🇳🇿 NZ &🇹🇭 rates decision; 🇲🇾 CPI.
We got G-20 Xi & Trump meeting & trade-deal hope/hopelessness 🇺🇸🇨🇳
Econ data for this wk: 🇩🇪 IFO, 🇺🇸 New home sales & consumer confidence & durable goods order; 🇳🇿 NZ &🇹🇭 rates decision; 🇲🇾 CPI.
We got G-20 Xi & Trump meeting & trade-deal hope/hopelessness 🇺🇸🇨🇳
JPO answered markets' prayer & opened door for rate cuts; USD declined since JPO whispered👂🏻 sweet words to markets. This is helpful for EM Asia as it loosens financial conditions.
Believe it or not, markets actually want weak US data so cuts materialize &DXY can't be strong🤷🏻♀️🤔
Believe it or not, markets actually want weak US data so cuts materialize &DXY can't be strong🤷🏻♀️🤔

I'll be on Bloomberg Radio Thursday at 9am to speak about outlook for EM Asia for H2 2019 🤗. After this, @Trinhnomics taking 2 wks compliance leave so no Tweets/emails/work until 3rd wk of July (I may do a post mortem G20 if I have something to say & obvs gardening Tweets 🤗🍑)
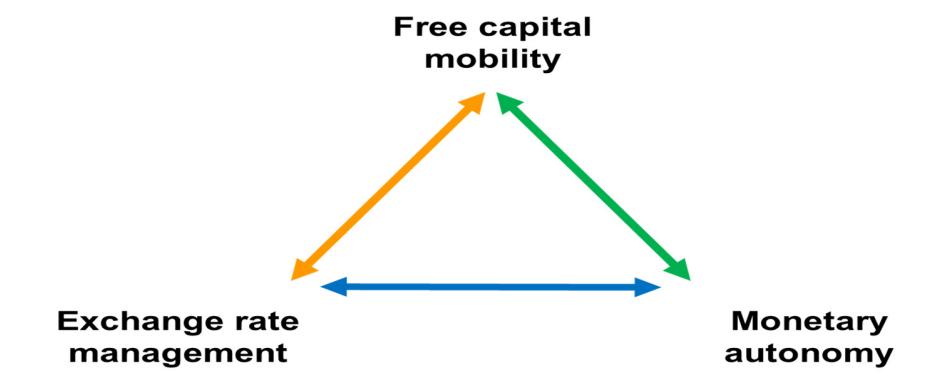
A great paper by Diwa Guiniguindo of the BSP (have known him since 2011 & a great technocrat) on how EM policymakers can respond to external volatility (the rise/decline of the USD for example); a good read to understand the other side of the market 👇🏻:
bis.org/publ/bppdf/bis…
bis.org/publ/bppdf/bis…
Reading the BIS quarterly bulletin for June & here are some key charts I want to share. Cross border claims by borrowing country (so the amt shows what they owe):
China - roughly 1trn USD for cross border bank liabilities (flow wise, contracted in 2015 &2016 & rebounded in 2017)
China - roughly 1trn USD for cross border bank liabilities (flow wise, contracted in 2015 &2016 & rebounded in 2017)

Notice the relationship b/n annual change of cross border claims or borrowing by China & the relationship w/ DXY. When DXY rallied in 2014 & 2015, borrowing in USD collapsed. When it weakened in 2017, it rebounded!!!
And u can see the reasoning here 👇🏻👇🏻
And u can see the reasoning here 👇🏻👇🏻
This is not just a China story where lending to China DECLINED when the USD is strong but a GLOBAL STORY. I explained why that is the case. Look at this from a lender perspective & it shows countries & currencies. Key players in the cross-borders lending game are: Japan & France

A lot of u see a 71-page econ paper & just blank as there are too many charts & unfamiliar terms. Let me explain in layman terms what these charts show: Top row has all currencies & they show Japan, US, France & Germany (respectively) KEY in lending to the world - other countries

If u look at the flow on the right of the rop row, u'll see a DECLINE in cross-border lending in 2015 & 2016 (yes higher USD doesn't help).
Let's look at USD lending 👇🏻, again Japan is key! But Japan did something diff - it lent when others were risk averse in 2015 & 2016.
Let's look at USD lending 👇🏻, again Japan is key! But Japan did something diff - it lent when others were risk averse in 2015 & 2016.

Let's look at lending in EUR - France is key here (and Germany, UK & Netherlands). Overall, cross-borders lending in EUR has DECLINED but what's interesting is that France lending in EUR follows USD (contracted in 2015 & 2016 but rose in 2017 & 2018) 🤷🏻♀️

Obvious whatever these countries lend across borders, then those are liabilities on the recipients' balance sheets. Let's look at borrowers 👇🏻:
These charts show BORROWING by EM collapsed in 2015 &2016 & rebounded in 2017 & 2018;
BORROWING by DM fell in 2015 & remained weak👇🏻.
These charts show BORROWING by EM collapsed in 2015 &2016 & rebounded in 2017 & 2018;
BORROWING by DM fell in 2015 & remained weak👇🏻.

USD liquidity dried up globally end 2018 as the DXY ascended; but this was much worse during 2015 when the DXY rose rapidly & why the global economy, & esp global markets, pray 🙇🏻♀️🙏🏻🙏🏻 for a weaker USD
JPO Sep 18: Rates no where near neutral🤨
Markets: We can't handle the hikes🙅🏻♀️
JPO Sep 18: Rates no where near neutral🤨
Markets: We can't handle the hikes🙅🏻♀️


Breakdown of bank lending (local credit+cross-border credit):
a) Globally growth is down but not as bad as 2015 but the leverage ratio still high
b) US up but deleveraged
c) Euro area up & deleveraged
d) Asia cross-border DOWN but leveraging via local credit so LEVERAGING!!!😬
a) Globally growth is down but not as bad as 2015 but the leverage ratio still high
b) US up but deleveraged
c) Euro area up & deleveraged
d) Asia cross-border DOWN but leveraging via local credit so LEVERAGING!!!😬

f) Latam down via local credit & flat via cross borders & flat/deleveraging in stock of debt
g) Central Europe down in local credit & slightly up for cross-border credit & DELEVERAGING.
EM Asia got the HIGHEST LEVERAGE RATIO thanks heavy dependence on banks for funding & so...
g) Central Europe down in local credit & slightly up for cross-border credit & DELEVERAGING.
EM Asia got the HIGHEST LEVERAGE RATIO thanks heavy dependence on banks for funding & so...

Notice that most of the EM Asia debt is China's where it has the HIGHEST LEVERAGE RATIO IN EM & so how China manages its banking system is key to global financial stability (funding heavily depends on banks vs in the US where corps fund via other channels like equities & credit).
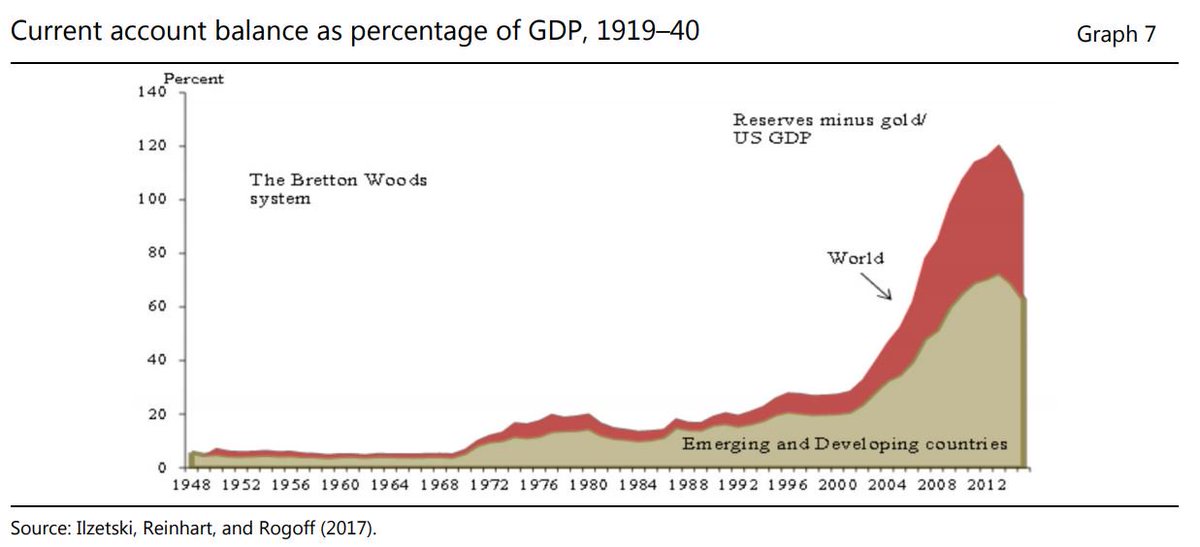
Got dollars??? Global shortage of dollars in recent years as banks became more risk averse as USD rose & that is bad news for EM. Now, markets are hoping & praying that JPO will CUT as he alluded. If he doesn't, then dun dun dun 🥁🥁🥁

Btw, PEAK DOLLAR LIQUIDITY outside the US was 2011 as a share of total loans (absolute value grew but relative value declined).

Chart below shows that most borrowing is in USD for most countries (China for example but isn't the only one, although EUR & JPY rising). So the tightening of USD liquidity HURTS 👇🏻👇🏻👇🏻

Let's look at this on a relative basis (credit % of GDP):
a) Euro area DELEVERAGED & peak was 2015 (see my other thread on why China similar to Euro area);
b) EM Asia LEVERAGING w/ China 🇨🇳 close to 3Xs GDP😬but India DELEVERAGED & Indonesia could use some financial deepening🤗
a) Euro area DELEVERAGED & peak was 2015 (see my other thread on why China similar to Euro area);
b) EM Asia LEVERAGING w/ China 🇨🇳 close to 3Xs GDP😬but India DELEVERAGED & Indonesia could use some financial deepening🤗

I don't cover Argentina but WHAT HAPPENED IN 2018??? Credit as a share of GDP off the chart 👇🏻👇🏻👇🏻👇🏻 🇦🇷

Don't worry, I don't forget about u - we're households in statistics so let's breakdown household debt (notice that it tends to be high for more developed markets as households don't access banking in a lot of EM). Let's look:
a) Euro area deleveraged ex France 🇫🇷Joie de vivre💪🏻
a) Euro area deleveraged ex France 🇫🇷Joie de vivre💪🏻
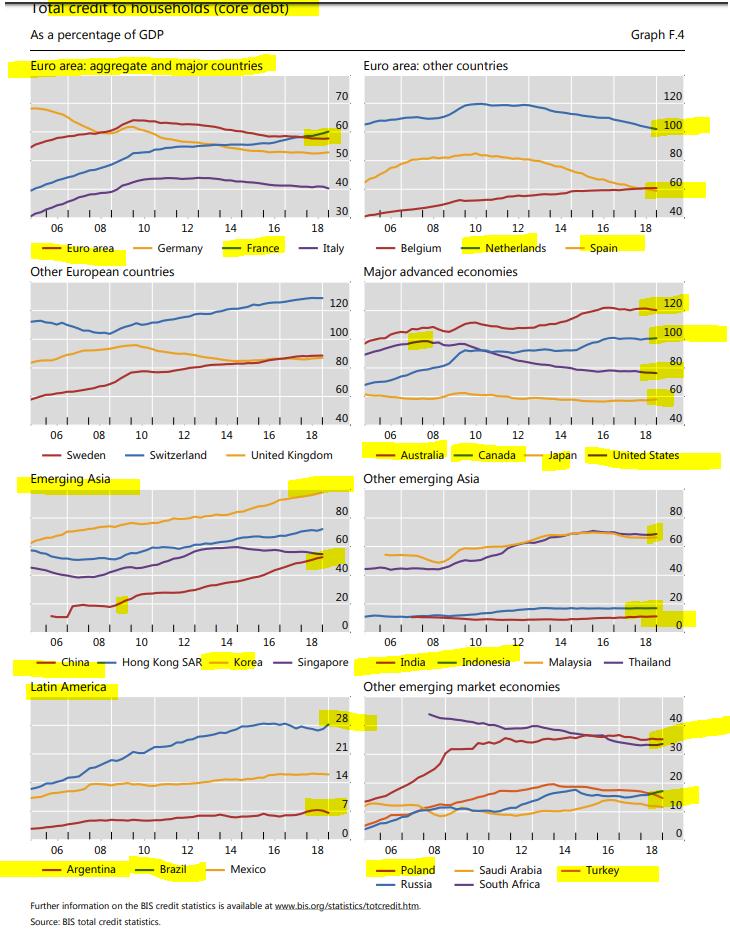
b) US households DELEVERAGED to less than 80% of GDP from peak of 100% while Australia & Canada leading; Mrs. Watanabe is le frugal;
c) EM Asia off the chart but debt concentrated in the usual suspects (Korea top & HK 2nd & look at China!!!) Chinese households used to be frugal!
c) EM Asia off the chart but debt concentrated in the usual suspects (Korea top & HK 2nd & look at China!!!) Chinese households used to be frugal!

Chinese households went from 20% of GDP in terms of debt in 2009 to now roughly 50% of GDP so that's 30% of GDP & most of this leveraging started around 2014. Meanwhile, Latin American households not so indebted, esp Mexicans!!!

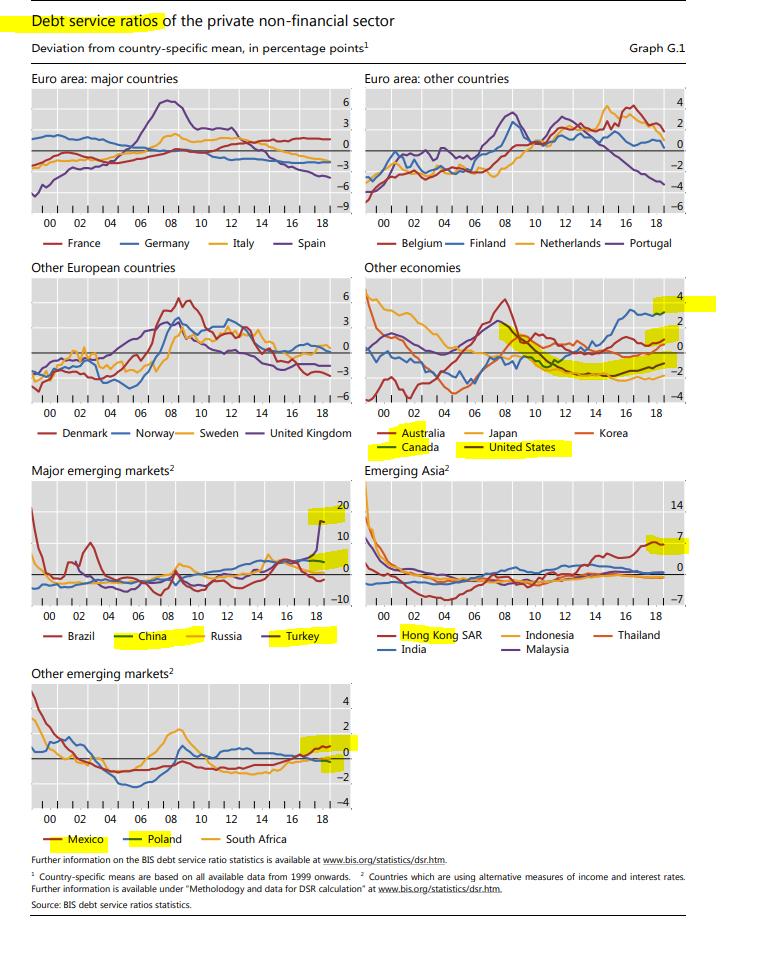
These are the mother of all charts & what every fixed income investor would be interested in: DEBT SERVICE RATIOS. Below are for private non-FI. Europe better thanks to NIRP. US & Japan 💪🏻& Canada & Australia not good (why RBA cut & will cut); Korea is worse but still good👇🏻👇🏻

Okay, let's zero in on EM since this is my bread & butter:
a) Turkey debt service ratio got really bad (we know that);
b) China got worse too;
c) Brazil Ok, surprising (I don't know anything about Brazil except soybeans &bbq);
d) HK worse; India, Thailand, Indonesia & Malaysia💪🏻
a) Turkey debt service ratio got really bad (we know that);
b) China got worse too;
c) Brazil Ok, surprising (I don't know anything about Brazil except soybeans &bbq);
d) HK worse; India, Thailand, Indonesia & Malaysia💪🏻
Let's look at debt service ratios of households (notice they measure standard deviation from mean):
a) Euro area better obvs thanks to NIRP;
b) USA & Japan got BETTER 💪🏻💪🏻;
c) Canada, Australia and Korea got WAY WORSE 👇🏻💪🏻(this is why I didn't understand the BOK's 25bps hike)
a) Euro area better obvs thanks to NIRP;
b) USA & Japan got BETTER 💪🏻💪🏻;
c) Canada, Australia and Korea got WAY WORSE 👇🏻💪🏻(this is why I didn't understand the BOK's 25bps hike)

Sorry, no data for EM. For non-FI firm debt service ratios:
a) Euro area good thanks to NIRP (sound like a broke record);
b) US worse but still good; gosh Canada is defo worse & Australia way better than Canada.
Clearly US weak spot is corps & Australia is households 😬
a) Euro area good thanks to NIRP (sound like a broke record);
b) US worse but still good; gosh Canada is defo worse & Australia way better than Canada.
Clearly US weak spot is corps & Australia is households 😬

PROPERTY PRICES:
a) NIRP pushed up Euro area but best is GERMANY 🇩🇪🥇💪🏻
b) USA still rising, Australia & Canada peaked but rose a lot; Japan rising thanks to NIRP!
c) HK off the chart; China, Korea, Singapore 📈
d) India & Indo💪🏻
e) Brazil😮
f) Wow Russia😮
g) Turkey cheaper👌🏻🏖️
a) NIRP pushed up Euro area but best is GERMANY 🇩🇪🥇💪🏻
b) USA still rising, Australia & Canada peaked but rose a lot; Japan rising thanks to NIRP!
c) HK off the chart; China, Korea, Singapore 📈
d) India & Indo💪🏻
e) Brazil😮
f) Wow Russia😮
g) Turkey cheaper👌🏻🏖️

Link to publication 👇🏻👇🏻👇🏻(Enjoy! Yes, you read this 71-pager full of charts w/ @Trinhnomics🤓 - that was fun 🤗!!!!)
Question: Are you convinced now that USD is King 👑???
bis.org/publ/qtrpdf/r_…
Question: Are you convinced now that USD is King 👑???
bis.org/publ/qtrpdf/r_…