,
10 tweets,
6 min read
Read on Twitter
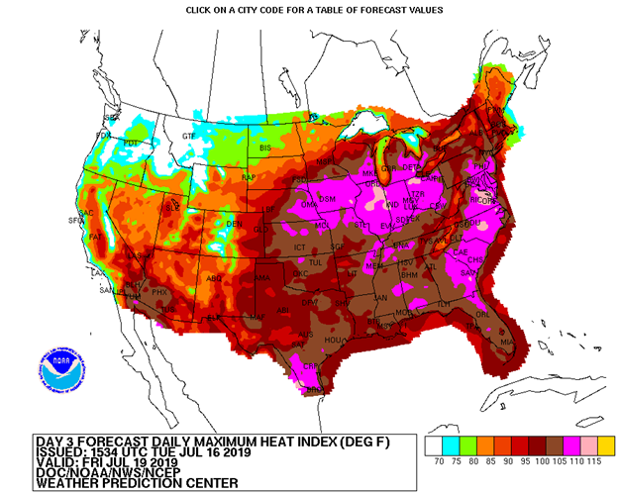
THREAD: Are you ready for this week’s heat? Are you ready for it to be the norm? Check out how this week’s forecast stacks up against this century’s #ExtremeHeat projection for your town and learn what’s at stake without climate action with our heat tool: act.ucsusa.org/HeatTool 
According to our new study, #KillerHeat is only going to get worse. We are projecting how the heat index, or “feels like” temperature, will likely change in your town by the middle of the century with no action to reduce global warming emissions. ucsusa.org/KillerHeat
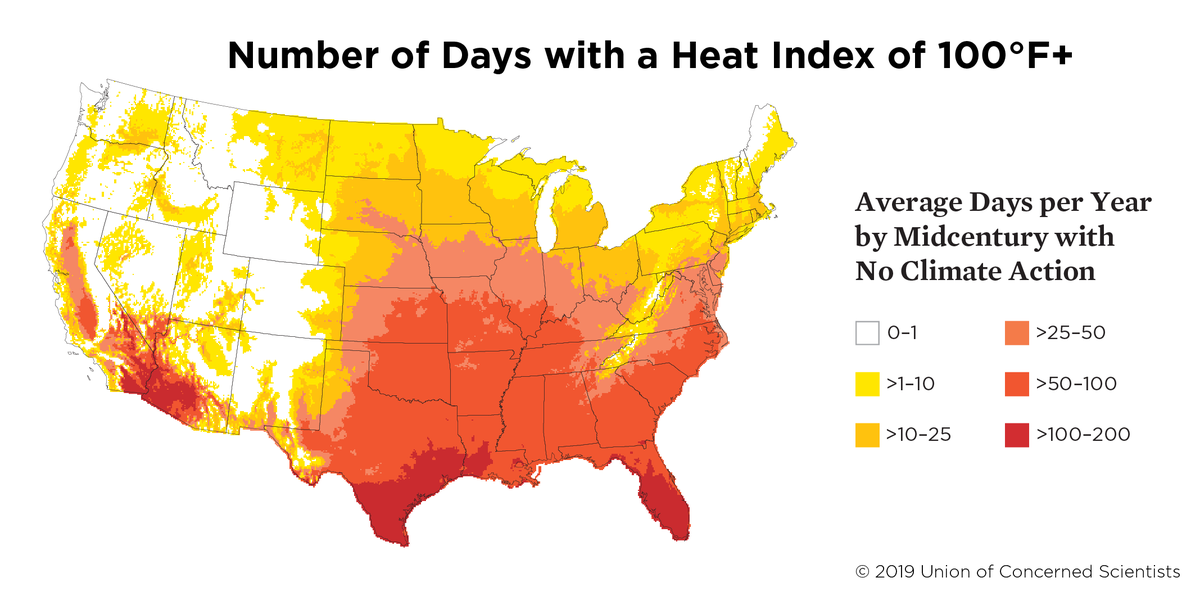
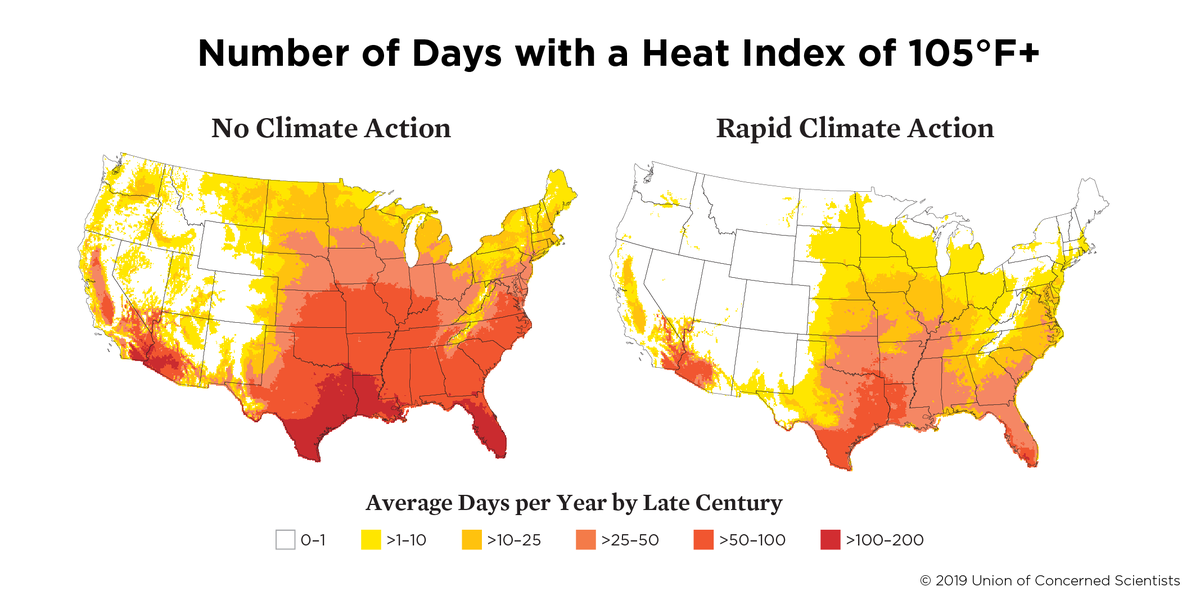
By late century, our #KillerHeat report projects that with no action, some areas will endure four months a year when the “feels like” temp will exceed 105°F. BUT, rapid bold action can drastically curb these extreme heat days. #ActOnClimate
Tampa’s feels like temp 🔥
This week: expected 5 days of 100+°F
Midcentury w/out climate action: 123 days per year of 100+°F
Late century w/out climate action: 155 days per year of 100+°F
Historically (1971-2000): 30 days per year of 100+°F
Your city? act.ucsusa.org/HeatTool
This week: expected 5 days of 100+°F
Midcentury w/out climate action: 123 days per year of 100+°F
Late century w/out climate action: 155 days per year of 100+°F
Historically (1971-2000): 30 days per year of 100+°F
Your city? act.ucsusa.org/HeatTool
Harrisburg’s feels like temp 🔥
This week: expected 4 days of 100+°F
Midcentury w/out climate action: 26 days per year of 105+°F
Late century w/out climate action: 51 days per year of 100+°F
Historically (1971-2000): 2 days per year of 100+°F
Your city? act.ucsusa.org/HeatTool
This week: expected 4 days of 100+°F
Midcentury w/out climate action: 26 days per year of 105+°F
Late century w/out climate action: 51 days per year of 100+°F
Historically (1971-2000): 2 days per year of 100+°F
Your city? act.ucsusa.org/HeatTool
Charleston’s feels like temp 🔥
This week: expected 4 days of 105+°F
Midcentury w/out climate action: 38 days per year of 105+°F
Late century w/out climate action: 77 days per year of 105+°F
Historically (1971-2000): 4 days per year of 105+°F
Your city? act.ucsusa.org/HeatTool
This week: expected 4 days of 105+°F
Midcentury w/out climate action: 38 days per year of 105+°F
Late century w/out climate action: 77 days per year of 105+°F
Historically (1971-2000): 4 days per year of 105+°F
Your city? act.ucsusa.org/HeatTool
Chicago’s feels like temp 🔥
This week: expected 2 days of 105+°F
Midcentury w/out climate action: 14 days per year of 105+ °F
Late century w/out climate action: 34 days per year of 105+°F
Historically (1971-2000): 1 day per year of 105+°F
Your city? act.ucsusa.org/HeatTool
This week: expected 2 days of 105+°F
Midcentury w/out climate action: 14 days per year of 105+ °F
Late century w/out climate action: 34 days per year of 105+°F
Historically (1971-2000): 1 day per year of 105+°F
Your city? act.ucsusa.org/HeatTool
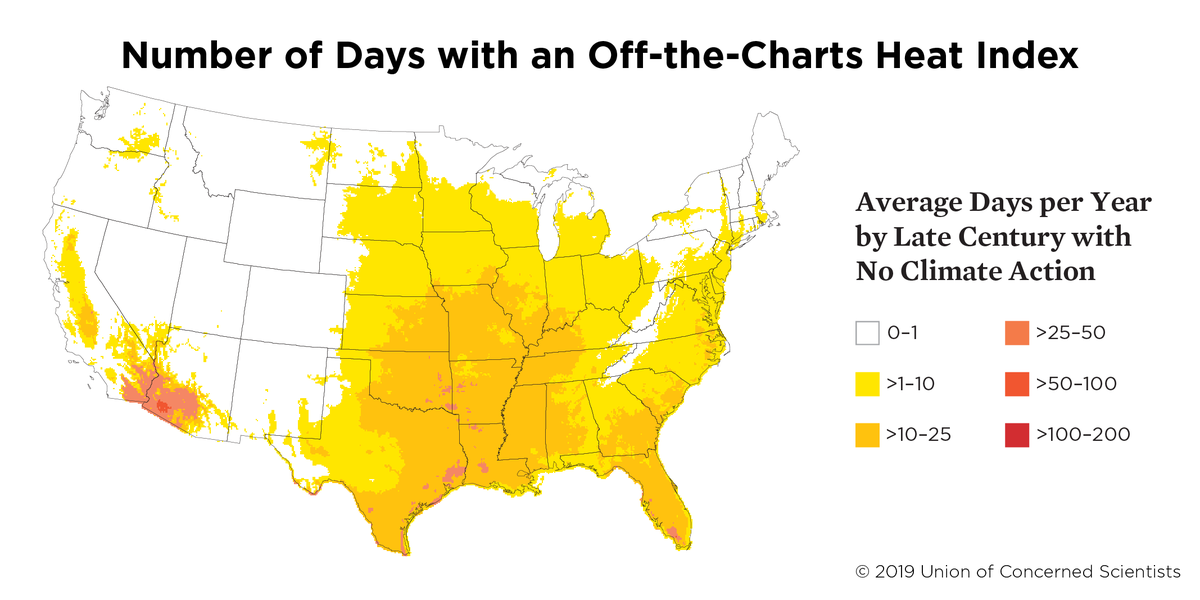
We also found that #KillerHeat could “break” the @NWS heat index by leading to widespread off-the-charts heat days (temperature and humidity that, combined, exceed the NWS calculable heat index values) even by mid-century. Late century shown here.
Extreme heat poses grave risks to human health. Learn about resources to protect yourself, family, friends and neighbors during this week’s #HeatWave and in the future. act.ucsusa.org/2SiMSXw
Did we not highlight your town’s future heat projection? Add your city to the list in the comments below using our new Heat Tool: act.ucsusa.org/HeatTool #KillerHeat