,
24 tweets,
13 min read
Read on Twitter
From end 2012 to Q1 2019 (7yrs), China debt to GDP ratio rose 63.2% to 259.4% of GDP (meaning at end 2012 it was less than 200% of GDP). Unless that 63.2% credit/gdp was into productive investment that raises future productivity, the incremental capital to output (ICOR)worsening 

The juxtaposition to China rapid growth of debt is the Eurozone deleveraging (credit/gdp ratio FALLING). Australia, Thailand, Malaysia & India have all deleveraged.
Indonesia capital market remains undeveloped & needs to deepen. Smallest debt to GDP ratio in Asia 👇🏻👇🏻👇🏻.
Indonesia capital market remains undeveloped & needs to deepen. Smallest debt to GDP ratio in Asia 👇🏻👇🏻👇🏻.

How do u deleverage? Well, several ways but ultimately your DEBT has to rise LESS than your OUTPUT.
DEBT/GDP = ratio & that ratio has to fall.
If ur output (GDP) falls, then your debt growth has to fall FASTER! That is how you deleverage. How u do so is up to u. NIRP is 1 way
DEBT/GDP = ratio & that ratio has to fall.
If ur output (GDP) falls, then your debt growth has to fall FASTER! That is how you deleverage. How u do so is up to u. NIRP is 1 way
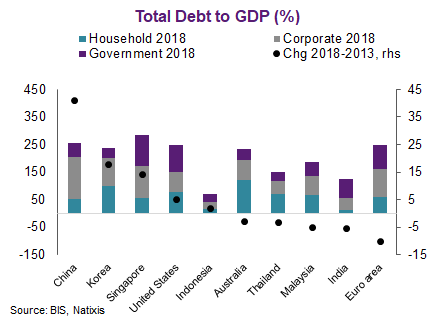
When you look at a chart like this one (data is free & from the @BIS_org so free free to download & play around), u should look at:
*Stock (total debt), composition of debt (household, firms, government), & finally the RATE OF CHANGE of the total & drivers of change.
Let's look
*Stock (total debt), composition of debt (household, firms, government), & finally the RATE OF CHANGE of the total & drivers of change.
Let's look

@BIS_org This chart tells u that China stock of debt is UNEVENLY DISTRIBUTED (gov debt too small & firms shoulder the costs of risks & they pay higher costs than the gov usually). The stock of debt is also small for household but has risen a lot.
The US is more even & gov debt biggest!
The US is more even & gov debt biggest!

@BIS_org You can see from the China debt stock chart that FIRMS are too large in terms of stock & so their costs of funding is high & so for China to deleverage firms will have to either:
Have output grow faster (profitability) or/and lower costs of funding.
Profitability declined so..
Have output grow faster (profitability) or/and lower costs of funding.
Profitability declined so..

@BIS_org For China to deleverage, then it needs to LOWER FUNDING COSTS. Hence that whole loan prime rate thing but note that since introduction of LPR, we only got minor reduction as the 5y LPR didn't change.
So this'll need to change if China wants to deleverage or profitability rises.
So this'll need to change if China wants to deleverage or profitability rises.
@BIS_org One other way is to follow the USA road - which is for the GOVERNMENT TO ABSORB THE COSTS OF BAD INVESTMENT.
What does that mean? After the GFC, the US gov bought toxic assets & the central bank helped buy that too to lower both gov funding costs & help the economy deleverage.
What does that mean? After the GFC, the US gov bought toxic assets & the central bank helped buy that too to lower both gov funding costs & help the economy deleverage.
@BIS_org As profitability was unlikely to recover fast in the short-term, much easier to lower funding costs. So that happened. The US gov, thanks to the fact that it got both fiscal & monetary, was able to decide who to bear the costs & ACTED SWIFTLY.
Hence banks in the US recovered etc
Hence banks in the US recovered etc
@BIS_org For China, the road to deleveraging is: lower interest expense for firms (and everyone of course but firms key since they got the most debt), make the distribution of debt more even (so far households absorbing more debt but should be gov) & preferably the gov as funds cheaper.
@BIS_org Note that the Euro zone introduced NIRP - started in 2014 - that basically LOWERED FUNDING COSTS FOR GOV & so it is deleveraging via the government side (think Greece) via interest expense & also cap on level of fiscal deficit.
So nominal GDP > growth of debt & interest payments
So nominal GDP > growth of debt & interest payments
@BIS_org You can see here that India got a problem. It has DELEVERAGED (thanks partly to demonetization but also due to the tightening of the USD). India will need to sort out its liquidity issue if it wants to grow. Balance sheet contraction is not good if u want growth.
OK, Indonesia👇🏻
OK, Indonesia👇🏻

@BIS_org Indonesia had this advertisement in Bloomberg when I moved to Asia - I don't know if u remember. It is called the trillion-dollar economy. Since that advert, Indonesia has not MOVED MUCH BEYOND 1 TRILLION.
Why? Look at that chart & u will see. Total leverage ratio is only 70%👇🏻
Why? Look at that chart & u will see. Total leverage ratio is only 70%👇🏻

@BIS_org Some people are upset at accounting of firms for China. Most countries have SOEs too. France etc. What matters here is that the FIRMS PAY HIGHER FUNDING COSTS. So the decomposition tells NOT OWNERSHIP (gov vs private) but also COSTS OF FUNDS. Order of costs:
Households>firms>gov
Households>firms>gov
@BIS_org Meaning, when u look at the composition of the stock, u should consider that the GOV FUNDS the cheapest in an ECONOMY.
So if an economy has A LOT OF HOUSEHOLD DEBT (Australia, Canada, Korea, etc) then u know that COSTS OF DEBT HIGH!!!
RBA rate = 1% but mortgages, credit card??
So if an economy has A LOT OF HOUSEHOLD DEBT (Australia, Canada, Korea, etc) then u know that COSTS OF DEBT HIGH!!!
RBA rate = 1% but mortgages, credit card??
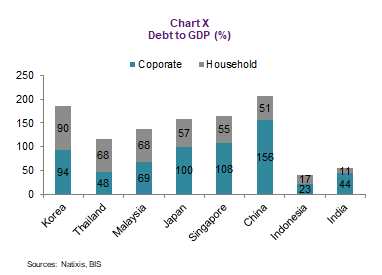
@BIS_org Look at this chart for firms & households & organized by HIGHEST HOUSEHOLD DEBT AS A SHARE OF GDP:
#1 Korea
#2 Thailand
#3 Malaysia
#4 Japan
#5 Singapore
#6 China
#7 Indonesia
#8 India
Korea has 90% of GDP household debt. BOK rate is 1.5% & u bet Korean households paying higher
#1 Korea
#2 Thailand
#3 Malaysia
#4 Japan
#5 Singapore
#6 China
#7 Indonesia
#8 India
Korea has 90% of GDP household debt. BOK rate is 1.5% & u bet Korean households paying higher
@BIS_org Oh, I forgot to include Australia, which is the true KING of household debt of Asia Pacific, at, wait for it: 119.4% of GDP, which is lower than the peak of 121.3% of GDP one year ago.
Now u know why the RBA lowered rates. U bet they are not paying 1% RBA cash rate.
Now u know why the RBA lowered rates. U bet they are not paying 1% RBA cash rate.
@BIS_org The biggest decline is driven by Indian firms where debt FELL to 44.8% of GDP by end 2018 from 51.9% in 2012 or -7.1% of GDP in deleveraging of Indian firms.
Indian INC balance sheet CONTRACTED!
What about households? Well, they have limited access to banking & 11.3% of GDP!
Indian INC balance sheet CONTRACTED!
What about households? Well, they have limited access to banking & 11.3% of GDP!
@BIS_org Below is a comparison between China & India in terms of debt as a share of GDP (non FI = (gov + household + firms)/nominal GDP)
You can see clearly below India basically DELEVERAGED 👇🏻👇🏻👇🏻 as China massively expanded its balance sheet. Modi accelerated the deceleration!
You can see clearly below India basically DELEVERAGED 👇🏻👇🏻👇🏻 as China massively expanded its balance sheet. Modi accelerated the deceleration!
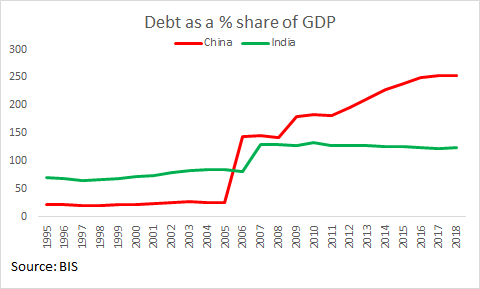


@BIS_org Guys, both China & India data for firm & household debt start around 2007 (gov debt goes back further) so look at it from 2007. The zero before that just indicates no data not that it was zero. I should have deleted that.